

Valuation Barometer · Preliminary reading
How many stocks trade below their fair value?
Once a quarter we record which share of the stocks we value worldwide trades below or above its fair value, by region, index, sector and country. Every company counts once, from global giant to small cap.
The median stock trades above fair value, which sits 6% below the price.
Preliminary reading of Nov 13, 2026 (prices and fair values of that day). The first fixed reference date is Dec 31, 2026; its figures appear on the first day of the new quarter.
Below and above fair value, by region and index
Left of the line: stocks below their fair value; right: stocks above it. The strong colour marks a gap of more than 10%.
more than 10% below up to 10% below up to 10% above more than 10% above
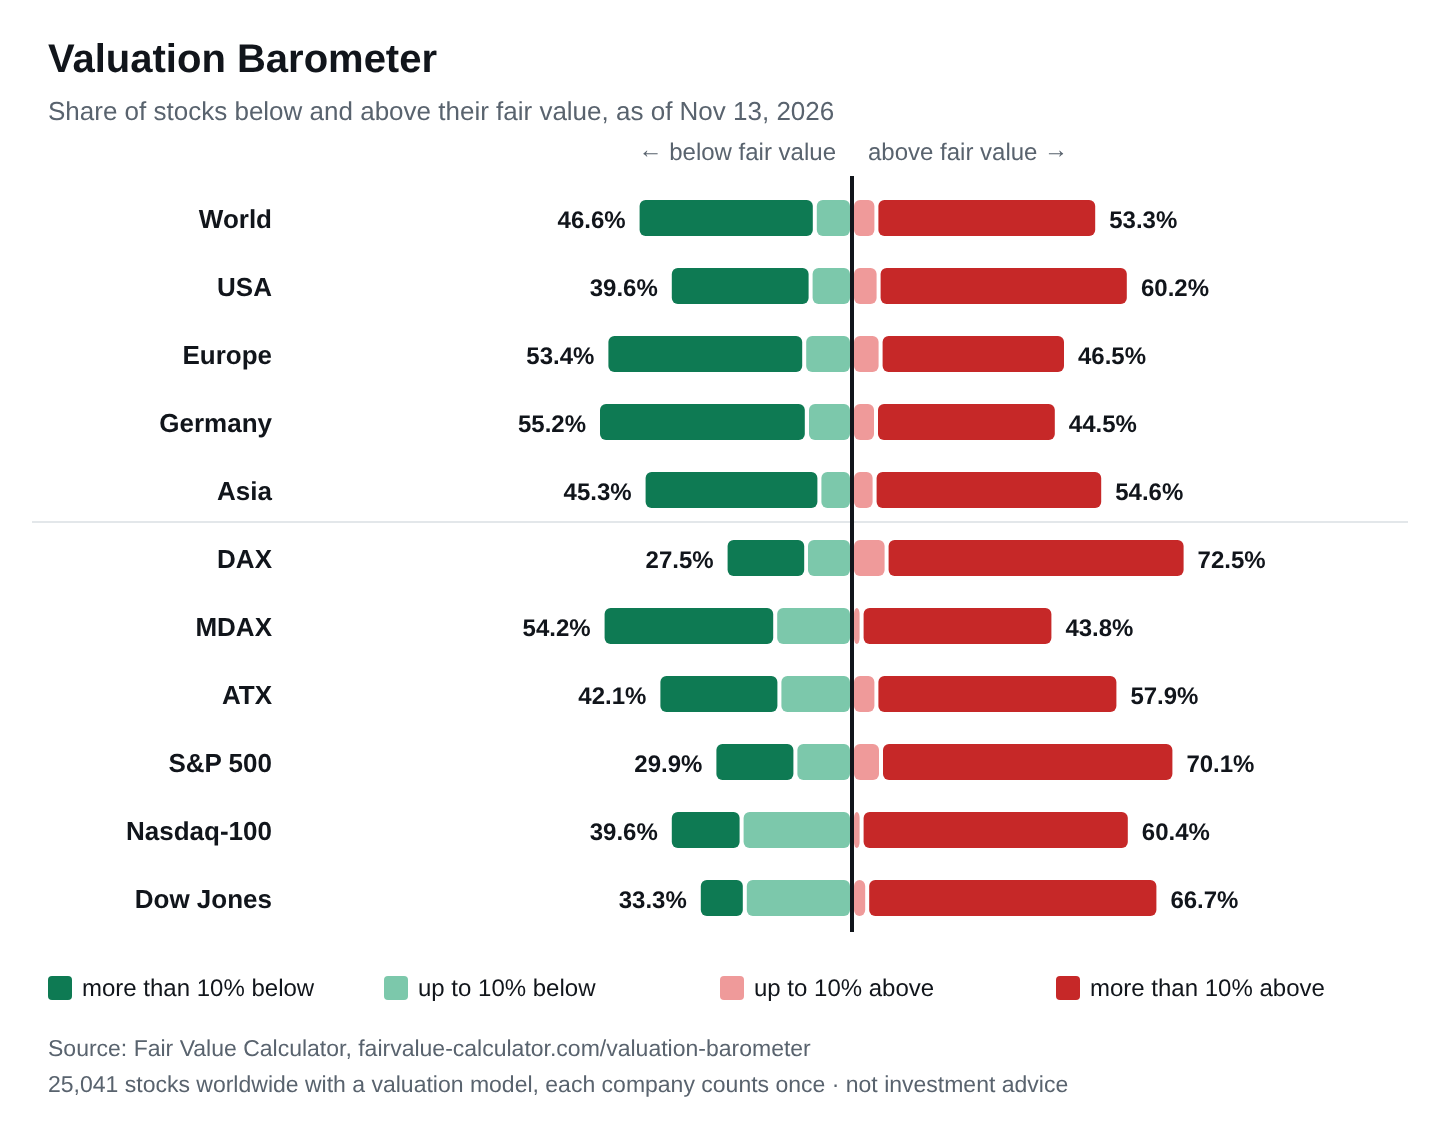
By region and index
Indices by their current constituents, counted per security. Click an index to see every single stock.
| Region | Stocks | below FV | above FV | Median upsideMedian |
|---|---|---|---|---|
| World25,041 stocks | 25,041 | 46.6% | 53.3% | -5.9% |
| USA3,819 stocks | 3,819 | 39.6% | 60.2% | -14.9% |
| Europe3,758 stocks | 3,758 | 53.4% | 46.5% | +5.4% |
| Germany366 stocks | 366 | 55.2% | 44.5% | +7.5% |
| Asia14,614 stocks | 14,614 | 45.3% | 54.6% | -8.5% |
| Index | Stocks | below FV | above FV | Median upsideMedian |
|---|---|---|---|---|
| DAX40 stocks | 40 | 27.5% | 72.5% | -18.2% |
| MDAX48 stocks | 48 | 54.2% | 43.8% | +5.1% |
| ATX19 stocks | 19 | 42.1% | 57.9% | -9.5% |
| S&P 500495 stocks | 495 | 29.9% | 70.1% | -25.7% |
| Nasdaq-10096 stocks | 96 | 39.6% | 60.4% | -17.2% |
| Dow Jones30 stocks | 30 | 33.3% | 66.7% | -28.2% |
By sector
The eleven GICS sectors, sorted by the share below fair value.
| Sector | Stocks | below FV | above FV | Median upsideMedian |
|---|---|---|---|---|
| Communication Services961 stocks | 961 | 57.5% | 42.5% | +10.8% |
| Consumer Discretionary3,262 stocks | 3,262 | 54.1% | 45.8% | +7.0% |
| Real Estate1,600 stocks | 1,600 | 53.4% | 46.3% | +7.2% |
| Consumer Staples1,576 stocks | 1,576 | 50.4% | 49.5% | +0.6% |
| Industrials4,945 stocks | 4,945 | 45.7% | 54.2% | -6.9% |
| Health Care1,793 stocks | 1,793 | 44.8% | 54.9% | -9.2% |
| Energy818 stocks | 818 | 44.3% | 55.5% | -8.0% |
| Utilities624 stocks | 624 | 43.6% | 56.3% | -11.9% |
| Financials2,723 stocks | 2,723 | 43.4% | 56.4% | -9.4% |
| Information Technology3,206 stocks | 3,206 | 42.5% | 57.3% | -13.6% |
| Materials2,886 stocks | 2,886 | 39.5% | 60.5% | -15.0% |
By country
Countries with at least 100 valued stocks, by the company's home country, not its trading venue.
| Country | Stocks | below FV | above FV | Median upsideMedian |
|---|---|---|---|---|
| Brazil203 stocks | 203 | 75.4% | 24.1% | +43.5% |
| Poland387 stocks | 387 | 66.4% | 33.6% | +25.1% |
| Singapore362 stocks | 362 | 66.3% | 33.1% | +22.9% |
| Thailand691 stocks | 691 | 66.1% | 33.4% | +23.2% |
| South Korea1,555 stocks | 1,555 | 65.9% | 34.1% | +32.3% |
| Hong Kong1,256 stocks | 1,256 | 65.4% | 34.3% | +40.3% |
| South Africa162 stocks | 162 | 65.4% | 34.6% | +29.6% |
| Philippines129 stocks | 129 | 63.6% | 35.7% | +25.9% |
| France387 stocks | 387 | 62.0% | 37.5% | +13.8% |
| United Kingdom678 stocks | 678 | 60.6% | 39.1% | +10.0% |
| Malaysia804 stocks | 804 | 59.3% | 39.8% | +13.3% |
| Finland153 stocks | 153 | 58.8% | 41.2% | +10.8% |
| Norway174 stocks | 174 | 57.5% | 42.5% | +9.4% |
| Indonesia602 stocks | 602 | 56.3% | 43.7% | +11.0% |
| Germany366 stocks | 366 | 55.2% | 44.5% | +7.5% |
| Vietnam171 stocks | 171 | 51.5% | 48.5% | +1.8% |
| Saudi Arabia284 stocks | 284 | 51.4% | 48.6% | +4.7% |
| Turkey408 stocks | 408 | 51.2% | 48.8% | +3.0% |
| Israel358 stocks | 358 | 49.7% | 50.0% | 0.0% |
| Canada561 stocks | 561 | 48.7% | 51.3% | -1.9% |
| Australia615 stocks | 615 | 48.5% | 50.6% | -1.4% |
| Italy268 stocks | 268 | 48.5% | 51.5% | -2.3% |
| Sweden455 stocks | 455 | 47.9% | 52.1% | -3.6% |
| Greece111 stocks | 111 | 45.0% | 55.0% | -5.0% |
| Spain151 stocks | 151 | 44.4% | 55.6% | -7.9% |
| Taiwan1,696 stocks | 1,696 | 40.3% | 59.7% | -14.3% |
| USA3,819 stocks | 3,819 | 39.6% | 60.2% | -14.9% |
| Denmark110 stocks | 110 | 38.2% | 61.8% | -15.9% |
| India3,138 stocks | 3,138 | 32.0% | 68.0% | -31.1% |
| China3,941 stocks | 3,941 | 31.8% | 68.1% | -34.2% |
| Switzerland191 stocks | 191 | 26.7% | 73.3% | -26.7% |
more than 10% below fair value (cheap)near fair value (±10%)more than 10% above fair value (expensive)
History
The series starts with the reference date of December 31, 2026. We deliberately do not back-calculate earlier quarters: our archive of displayed fair values only reaches back to September 2026, it does not hold the price on a reference date, and valuation rules added since then change the counted universe. A back-calculated figure would not be comparable with the ones that follow.
Methodology
- We count every stock the tool lists visibly with a fair value, one listing per company: 25,041 stocks as of Nov 13, 2026. Fair value comes from 26 valuation models, the same figure as on every stock page.
- Not counted: 4,922 companies where no valuation model applies and the tool only shows an estimate. That estimate leans heavily on the price and would inflate the share above fair value.
- Below fair value means: price below fair value. More than 10% below or above uses the same thresholds as the colours in the tool (green, amber, red). The median shows where the middle stock of the group sits.
- Every company counts once, regardless of size. The view weighted by market value, where large companies count more, is on the market valuation page.
- Regions and countries by the company's home country (evidenced by ISIN and home exchange), sectors by GICS. Indices by the holdings of an index fund, cross-checked against a second fund (DAX, MDAX, ATX, S&P 500, Nasdaq-100, Dow Jones).
- The reference date is the end of the quarter. We calculate on the first day of the new quarter after closing prices are imported; the figures are not changed afterwards. We keep improving the valuation models; each reference date shows the models as they stood on that day.
How to cite
Free to use under CC BY 4.0, with attribution and a link. For questions and custom analyses, reach us via the press page.
Frequently asked questions
How many stocks are undervalued?
As of Nov 13, 2026, 46.6% of the 25,041 stocks we value worldwide trade below their fair value, 38.5% of them more than 10% below. 53.3% trade above it.
Are German stocks cheap?
Of the German stocks we value, 55.2% trade below fair value; in the DAX it is 27.5% (11 of 40). The large caps are therefore valued more richly than the broad German market.
How expensive are US stocks?
In the US, 39.6% of the stocks we value trade below fair value, in the S&P 500 29.9%. The median S&P 500 stock trades above fair value, which sits 26% below the price.
How does the barometer differ from the market valuation?
The market valuation weights each stock by its market value, so large companies drive the result. The barometer counts stocks: one vote per company. Both use the same fair values.
Is this investment advice?
No. The barometer describes how our valuation models see the market on a given date. It is not investment advice and not a forecast.