Csquare, Inc. (CSQR) fair value: what the stock is really worth
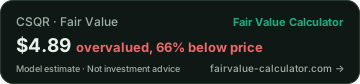
As of Nov 20, 2026: fair value (intrinsic value) of Csquare, Inc. stock $4.89, price $14.52, that is 66.3% below the price, quality 11 out of 100. Rating: strongly overvalued. Calculated from audited financials with 5 of our 26 valuation models and 37 quality factors, updated daily.
Csquare, Inc. operates as a digital infrastructure platform that provides interconnection services. The company offers a geographically proximate, carrier-neutral colocation platform with pre-built power and cooling infrastructure.
Show moreShow less
It also provides operating requirements solution, including the need for network proximity, consistent operating standards, and high service availability; and sub-5 MW colocation deployments within multi-customer interconnection-rich environments.
The company serves enterprise, network, cloud, and technology customers. The company was incorporated in 2018 and is headquartered in Coppell, Texas. Csquare, Inc. is a subsidiary of Dawn Topco L.P.
Stock analysis
Csquare, Inc. (CSQR) currently trades at $14.52, while our model-based Fair Value estimate is $4.89, 66% below the price, so the stock looks overvalued today.
Show more
Valuation
Bull case: the Multiples group reads highest at a median of $14.46 per share, and 1 of the 5 models we run sit above the $14.52 price.
Bear case: the Earnings-Based group reads lowest at $4.89, and 4 of the 5 models stay below the price. Data coverage for this calculation is low.
Scenario range: $4.24 (bear) to $5.45 (bull), the price of $14.52 sits above it. Bear and bull are the same models on cautious and optimistic assumptions, a range, not a price target.
Quality & growth
The Quality Score stands at 11/100 (below-average quality), in the Technology sector.
Expensive Growth: The company is growing, but growth may require heavy reinvestment or weak cash conversion.
Csquare, Inc. reported revenue of $987M in FY2025 versus $198M in FY2023, a compound +123.1%/yr. Reported net income was −$120M in FY2025.
Our AI-assisted moat analysis scores the competitive advantage at 22 out of 100 (low confidence).
What moves the price
For context, the median of 10 Technology peers we cover trades at 26% fair-value upside, at −66%, CSQR screens richer than that median.
Fair Value models
Bear$4.24Fair Value $4.89Bull$5.45
Price $14.52 · Downside -66.3%
Model ⓘEach model values the company its own way (discounted cash flow, earnings, assets, dividends). The fair value above starts from their evidence-weighted blend, not from a single model. In cyclical trough or peak years, after dilution or a stock split it is adjusted afterwards, so it can sit above or below the models.Bear ⓘBear = the cautious scenario: the same model computed with conservative anchors (lower growth, margins and valuation multiples). Together with Bull it frames a plausible valuation range, not a price target.BaseBull ⓘBull = the optimistic scenario: the same model computed with favourable anchors (higher growth, margins and valuation multiples). Together with Bear it frames a plausible valuation range, not a price target. If a model's bull case is above four times its base value, the table shows that limit with a > sign (like the overall Bull above): beyond it no assumption holds.Coverage ⓘCoverage = how well-backed THIS model's estimate is for this stock (0–100): how complete and reliable its input data are, and how well the model fits the company. The final Fair Value is an evidence-weighted blend, so better-evidenced models count more. Green ≥70, amber 50–69, grey below 50.
In the last 6 months, 4 officers or directors bought shares worth $488,349, most recently on Nov 13, 2026. Buying cluster
BuyTerri PizzutoDirector2,000 shares at $16.96$33,920Nov 13, 2026
BuyPhilip M KelleyDirector10,000 shares at $17.24$172,400Nov 11, 2026
BuySteven R. E. CookChief Financial Officer2,028 shares at $17.26$35,000Nov 11, 2026
BuySpencer Edward MulleeChief Executive Officer, Director13,573 shares at $18.20$247,029Nov 11, 2026
Plus 6 other filings such as grants, option exercises or tax withholding. They are not market purchases or sales.
Sales are often planned (taxes, diversification, 10b5-1 plans). Purchases with their own money are seen as the stronger sign. For information only: not part of the quality score or Fair Value.
Growth Quality ⓘGrowth is valuable only when reinvestment earns attractive returns (Aswath Damodaran): sustainable growth depends on return on capital, reinvestment and efficiency. Basis: total company revenue over the periods shown on the cards (3Y/5Y/all years), not per share, so a merger can show up as a growth jump; per-share earnings growth is in the value-creation card.26/100
The company is growing, but growth may require heavy reinvestment or weak cash conversion.
What shareholders gained per year ⓘWe only publish this rate when it is defensible. Reason: no share-count history
AI conclusion: The carrier-neutral colocation platform with its expanding data center pipeline forms the main strength, while ongoing interest costs from the post-IPO capital structure weigh on results amid losses and negative free cash flow.
Main risk: Ongoing interest costs tied to the post-IPO capital structure risk hitting margins and cash flow if new capacity fails to deliver enough incremental recurring revenue.
Csquare runs a carrier-neutral colocation platform with a large pipeline of new data center capacity coming online. Demand for reliable interconnection keeps rising across enterprises and networks, yet the post-IPO capital structure adds ongoing interest costs that weigh on results. Will the expansion pipeline generate enough incremental recurring revenue to ease those pressures, or will scaling costs continue to outpace operating gains?
Price, fair value, quality and upside side by side.
Free, no sign-up
Peer GroupⓘHow this stock ranks against its industry: the green marker is this stock, the band is the typical 25–75% peer range, and the tick is the median.Information Technology Services · 522 stocks
Beats the industry median on 3/8 measures
Overall it trails its industry peers.
Valuation
Quality Score11 · Bottom 25%
Fair Value upside−66.3% · Bottom 25%
Profitability
Return on assets0.0% · Below median
Net margin (12 months)−21.8% · Bottom 25%
Operating margin (12 months)6.0% · Above median
Growth and dividend
Revenue growth (quarter YoY)25.6% · Top 25%
Valuation Multiplesvs Information Technology Services median · lower = cheaper
P/S (12 months)2.20× · Pricier than median
EV/EBITDA6.1× · Cheapest 25%
Strength profile in five axes (Snowflake)
This stockSector peers
VALUE (fair-value potential)0· sector 36
FUTURE (revenue growth)100· sector 32
PAST (return on equity)0· sector 30
HEALTH (low debt)–
DIVIDEND (yield)0· sector 41
VALUE 0: the price sits above our fair-value range.
For bloggers, editors and developers: paste this into your site or blog (a “Custom HTML” block in WordPress), it shows the current fair value and links back here. Free, plain HTML, and welcome. Full data streams (CSV/JSON) at /developers.
Cite: Fair Value Calculator (2026). "Csquare, Inc. Fair Value". https://www.fairvalue-calculator.com/stock/CSQR
Frequently asked questions
Is Csquare, Inc. (CSQR) overvalued or undervalued?
As of Nov 16, 2026, our model estimates a fair value of $4.89 versus a price of $14.52, about 66% lower (overvalued).
What is the fair value of CSQR?
Our model-based fair value for Csquare, Inc. is $4.89 (as of Nov 16, 2026), built from audited fundamentals. The current price: $14.52.
What is the quality score of CSQR?
Csquare, Inc. has a Quality Score of 11/100. It measures business quality (profitability, growth, cash flow, balance-sheet strength, investment discipline, share issuance). Market factors such as price momentum and volatility do not enter the number; they are shown separately in the detail view.
What is the price target for Csquare, Inc. (CSQR)?
We do not set a price target; the yardstick is the fair value of $4.89 (as of Nov 16, 2026) from 5 valuation models. Cautious scenario $4.24, optimistic scenario $5.45. It is a calculation from audited fundamentals, not an analyst target.
What is the Csquare, Inc. stock forecast for 2026?
Our models put fair value at $4.89, about 66% lower versus a price of $14.52 (overvalued). Cautious scenario $4.24, optimistic scenario $5.45. The calculation is refreshed regularly with new filings.
What is the revenue of Csquare, Inc. (CSQR)?
Csquare, Inc. reported trailing-twelve-month revenue of about $1.1B (latest available figure, as of Nov 16, 2026).
What is the intrinsic value of Csquare, Inc. (CSQR)?
Intrinsic value and fair value mean the same thing: what the business is worth on its numbers, independent of the share price. For Csquare, Inc. it is $4.89 per share (as of Nov 16, 2026), against a price of $14.52. It is the blended result of 5 valuation models in 3 families (Earnings-Based, Multiples, Economic Profit).
Is Csquare, Inc. stock overvalued or undervalued in 2026?
As of Nov 16, 2026, CSQR trades above its calculated fair value: price $14.52, fair value $4.89, a gap of about −66% (overvalued). The calculation is refreshed with each new quarterly report, so the verdict can change during the year.
Is fair value the same as the market price of CSQR?
No. The price is what the market pays today ($14.52); the fair value is what the company's own numbers justify ($4.89). For Csquare, Inc. the two are $9.63 per share apart. That gap is exactly why we show both numbers side by side.
How much is Csquare, Inc. worth?
The market values Csquare, Inc. at about $2.8B (market capitalisation, as of Nov 16, 2026). Per share that is $14.52; our models calculate a fair value of $4.89 per share.
What do the bullish and bearish scenarios say about CSQR?
Our models span a range for Csquare, Inc.: cautious scenario $4.24, base $4.89, optimistic $5.45 per share (as of Nov 16, 2026, price $14.52). The range comes from different growth and margin assumptions, not from analyst opinions.
Which stocks are comparable to Csquare, Inc.?
From the same area (Technology) we also value International Business Machines Corporation, Accenture plc, Tata Consultancy Services Limited, Infosys Limited, among others. Each of them has its own fair-value calculation on this site using the same models, so the comparison is like for like.
Is Csquare, Inc. stock attractive at the current price?
The data as of Nov 16, 2026: price $14.52, calculated fair value $4.89 (−66%), Quality Score 11/100, from 5 models. Whether that fits your horizon and risk tolerance is your call. We provide the calculation, not investment advice.
How is the fair value of CSQR calculated?
We run Csquare, Inc. through 5 models from 3 families: Earnings-Based, Multiples, Economic Profit. Every model gets the same audited fundamentals; the fair value of $4.89 builds on their evidence-weighted average, with the spread shown as a cautious and an optimistic scenario.
Is it still worth investing in stocks now?
The global stock market currently sits 10.1% above its aggregate fair value. Csquare, Inc. itself currently trades above fair value. An expensive market is no reason to stay out and no reason to buy everything at once: keep a broad savings plan running, buy single stocks only with money you can do without, and hold part of your money liquid while the market is high. The full picture including sectors is on is it worth investing now.
What is the share price of Csquare, Inc. (CSQR)?
The closing price on Nov 20, 2026 was $14.52. Our model-based fair value is $4.89, about 66% lower (overvalued). We carry closing prices from our data provider, not a live tick.
What should I pay attention to with Csquare, Inc. right now?
The price sits above even our optimistic bull case ($5.45). The favourable scenario is already priced in. Weak quality (11/100) and above fair value at the same time, the margin of safety is missing on both counts. The large gap to fair value rests on thin data (low evidence): fewer applicable models and a shorter history. Read it with extra caution.
Key figures of Csquare, Inc.
How large is the market capitalisation of Csquare, Inc. (CSQR)?
The market capitalisation of Csquare, Inc. is $2.8B. The stock-market value of the whole company: share price times number of shares. It is what the market asks for the entire business today.
What is the P/S ratio of Csquare, Inc. (CSQR)?
The price-to-sales ratio of Csquare, Inc. is 2.51 (last twelve months). Price to sales: market value relative to yearly revenue. Useful when profit is thin or distorted.
What are the earnings per share of Csquare, Inc. (CSQR)?
Earnings per share at Csquare, Inc. are $-1.97. Earnings per share over the last twelve months: total profit spread across every single share.
What is the net margin of Csquare, Inc. (CSQR)?
The net margin of Csquare, Inc. is −21.8% (last twelve months). How much of every unit of revenue ends up as profit. 10% means 10 cents of profit per dollar of sales.
What is the operating margin of Csquare, Inc. (CSQR)?
The operating margin of Csquare, Inc. is 6.0% (last twelve months). Profit from the core business (before interest and taxes) relative to revenue.
How fast is revenue growing at Csquare, Inc. (CSQR)?
Revenue at Csquare, Inc. is growing 25.6% in the last quarter versus the same quarter a year earlier. How much revenue grew in the last quarter versus the same quarter a year earlier (YoY). The 3-year average next to it puts the single quarter in context.
How much free cash flow does Csquare, Inc. (CSQR) generate?
The free cash flow of Csquare, Inc. is −$373M (fiscal year 2025). The cash truly left after running and investing in the business, this is what pays dividends and buybacks.
Free · no account needed
Watch Csquare, Inc. in the live analysis
One click puts Csquare, Inc. on your watchlist: fair value and trend at a glance, plus comparison, the diversification check and the 28,000+ stock screener.


 Thin data
Nov 16, 2026