

Cyclerion Therapeutics Inc (CYCN) fair value: what the stock is really worth
As of Oct 14, 2026: fair value (intrinsic value) of Cyclerion Therapeutics Inc stock $5.58, price $3.36, upside +66.1%, quality 51 out of 100. Rating: strongly undervalued. Calculated from audited financials with one of our 26 valuation models and 37 quality factors, updated daily.
- Keep an eye on it?Free in your watchlist: 5 stocks without an account, 10 with one Yes, for free
 Thin data
Nov 7, 2026
Cyclerion Therapeutics Inc
CYCN · USThe stock costs 40% less than our calculation considers fair.
What runs behind every stock
69 individual criteria per stock, every one traceable See the method →
Price vs Fair Value
White line = price, green steps = our fair value per fiscal year. As of Nov 7, 2026.
How to read this chart
60‑month range $0.1912 – $6.35 · fair‑value band $3.69 – $6.98 · the $3.36 price screens below the $5.58 fair value. As of Nov 7, 2026.
Every Wednesday you see whether Cyclerion Therapeutics is on track or worth a review, plus price against fair value. Free, up to 3 stocks.
We send you a confirmation link. Unsubscribe with one click.
Company profile
Cyclerion Therapeutics, Inc., a biopharmaceutical company, engages in the development of treatments for serious diseases serious diseases with novel sGC stimulators in both the central nervous system (CNS) and the periphery.
Show moreShow less
The company is developing Olinciguat, an orally administered vascular soluble guanylate cyclase (sGC) stimulator, which is in Phase 2 clinical trial to treat cardiovascular diseases; and Praliciguat, a systemic sGC stimulator for the treatment of rare kidney disease.
It has a license agreement with Akebia to develop, manufacture, medical affair, and commercializes Praliciguat and other related products. The company was incorporated in 2018 and is headquartered in Cambridge, Massachusetts.
Stock analysis
Cyclerion Therapeutics Inc (CYCN) currently trades at $3.36, while our model-based Fair Value estimate is $5.58, implying the stock looks roughly 40% undervalued today.
Show more
Valuation
How firm this estimate is: it rests on 1 models at a data quality of 96/100, which puts the data coverage at low.
Scenario range: $3.69 (bear) to $6.98 (bull), the price of $3.36 sits below it. Bear and bull are the same models on cautious and optimistic assumptions, a range, not a price target.
Quality & growth
The Quality Score stands at 51/100 (solid quality), in the Healthcare sector.
Weak Growth: Revenue growth is inconsistent: the periods point in different directions, so there is no trend to rely on.
Cyclerion Therapeutics Inc reported revenue of $2.1M in FY2025 versus $3.3M in FY2021, a compound −11.1%/yr. Reported net income was −$3.5M in FY2025.
Key figures
Market cap $2.2M Micro · P/S ratio 1.18 · EPS (TTM) $−11.62 · Return on equity −98.2% · Return on assets (EBIT) −76.0% (5-year average) · Operating margin −359% · Revenue (TTM) $1.9M · Revenue growth (YoY) −43.2%.
Competitive moat
Our AI-assisted moat analysis scores the competitive advantage at 12 out of 100 (low confidence).
What moves the price
The share trades about 26% below its 52-week high and 211% above its 52-week low, currently above its 200-day average.
For context, the median of 10 Healthcare peers we cover trades at 10% fair-value upside, at 66%, CYCN screens cheaper than that median.
Fair Value models
All 1 models by family
Quality Score breakdown
It rates the business: profits, how they develop, real cash, balance sheet, investing and share count.
Insider trades
In the last 6 months, no officer or director bought or sold shares on the open market.
Plus 3 other filings such as grants, option exercises or tax withholding. They are not market purchases or sales.
Sales are often planned (taxes, diversification, 10b5-1 plans). Purchases with their own money are seen as the stronger sign. For information only: not part of the quality score or Fair Value.
Source: SEC Form 4, as of Nov 6, 2026. All filings at the SEC ↗
Revenue & earnings trend
Watch CYCN, get fair value alerts →
Compare Cyclerion Therapeutics Inc with another stock
Price, fair value, quality and upside side by side.
Peer GroupⓘHow this stock ranks against its industry: the green marker is this stock, the band is the typical 25–75% peer range, and the tick is the median.Biotechnology · 558 stocks
Valuation Multiplesvs Biotechnology median · lower = cheaper
Strength profile in five axes (Snowflake)
Context: sector, industry, market
- Is the Health Care sector expensive or cheap?
- P/E, EV/EBITDA and margins by industry (reference tables)
- Net margin by industry
- P/B ratio by industry
- PEG screener for stocks with fair value
- Undervalued stocks: US Stocks
- Valuation of the USA market
Values & ESG
Does this company touch areas you may want to avoid? The classification is inferred from sector and industry.
Similar stocks
10 more Biotechnology stocks, each showing price versus our Fair Value estimate.
| Stock | Price | Fair Value | vs Fair Value | Compare |
|---|---|---|---|---|
| Incyte Corporation INCY | $119.65 | $199.23 | +67% | vs CYCN |
| Regeneron Pharmaceuticals, Inc REGN | $904.35 | $1,275 | +41% | vs CYCN |
| Samsung Biologics Co 207940 | 1,510,000 KRW | 1,667,600 KRW | +10% | vs CYCN |
| Vertex Pharmaceuticals Incorporated VRTX | $547.09 | $601.80 | +10% | vs CYCN |
| Genmab A/S GMAB | kr 3,527 | kr 3,880 | +10% | vs CYCN |
| WuXi Biologics (Cayman) Inc 2269 | HK$48.92 | HK$52.38 | +7% | vs CYCN |
| argenx SE ARGX | $927.21 | $908.40 | −2% | vs CYCN |
| CSL Limited CSL | A$200.77 | A$183.04 | −9% | vs CYCN |
| Celltrion, Inc 068270 | 210,000 KRW | 74,945 KRW | −64% | vs CYCN |
| Royalty Pharma plc RPRX | $67.30 | $19.01 | −72% | vs CYCN |
Explore undervalued stocks
More undervalued Healthcare stocks →
Try a ready-made strategy
Pick a strategy and jump into the live analysis with that exact screen applied.
Discover tools
For bloggers & editors: embed code + live data
For bloggers, editors and developers: paste this into your site or blog (a “Custom HTML” block in WordPress), it shows the current fair value and links back here. Free, plain HTML, and welcome. Full data streams (CSV/JSON) at /developers.
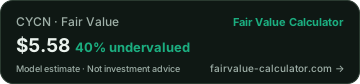
Cite: Fair Value Calculator (2026). "Cyclerion Therapeutics Inc Fair Value". https://www.fairvalue-calculator.com/stock/CYCN
Frequently asked questions
Is Cyclerion Therapeutics Inc (CYCN) overvalued or undervalued?
What is the fair value of CYCN?
What is the quality score of CYCN?
What is the price target for Cyclerion Therapeutics Inc (CYCN)?
What is the Cyclerion Therapeutics Inc stock forecast for 2026?
What is the revenue of Cyclerion Therapeutics Inc (CYCN)?
What is the intrinsic value of Cyclerion Therapeutics Inc (CYCN)?
Is Cyclerion Therapeutics Inc stock overvalued or undervalued in 2026?
Is fair value the same as the market price of CYCN?
How much is Cyclerion Therapeutics Inc worth?
What do the bullish and bearish scenarios say about CYCN?
How solid is the balance sheet of Cyclerion Therapeutics Inc (CYCN)?
How far is CYCN from its 52-week high?
Which stocks are comparable to Cyclerion Therapeutics Inc?
Is Cyclerion Therapeutics Inc stock attractive at the current price?
How is the fair value of CYCN calculated?
Is it still worth investing in stocks now?
What is the share price of Cyclerion Therapeutics Inc (CYCN)?
What should I pay attention to with Cyclerion Therapeutics Inc right now?
Key figures of Cyclerion Therapeutics Inc
How large is the market capitalisation of Cyclerion Therapeutics Inc (CYCN)?
What is the P/S ratio of Cyclerion Therapeutics Inc (CYCN)?
What are the earnings per share of Cyclerion Therapeutics Inc (CYCN)?
What is the return on equity of Cyclerion Therapeutics Inc (CYCN)?
What is the EBIT return on assets of Cyclerion Therapeutics Inc (CYCN)?
What is the operating margin of Cyclerion Therapeutics Inc (CYCN)?
How fast is revenue growing at Cyclerion Therapeutics Inc (CYCN)?
How much free cash flow does Cyclerion Therapeutics Inc (CYCN) generate?
How much net cash does Cyclerion Therapeutics Inc (CYCN) hold?
Watch Cyclerion Therapeutics Inc in the live analysis
One click puts Cyclerion Therapeutics Inc on your watchlist: fair value and trend at a glance, plus comparison, the diversification check and the 27,000+ stock screener.
Watch for free →Zero risk: nothing is ever charged. Your watchlist is yours, with or without an account.