EN DE
Watch Progressive Corp for free: we tell you when fair value or trend changes.
Data-driven stock valuation

Progressive Corp (PGR) fair value: what the stock is really worth

As of Nov 4, 2026: fair value (intrinsic value) of Progressive Corp stock $161, price $235, that is 31.5% below the price, quality 67 out of 100. Rating: overvalued. Calculated from audited financials with 6 of our 26 valuation models and 37 quality factors, updated daily.

  1. Keep an eye on it?Free in your watchlist: 5 stocks without an account, 10 with one Yes, for free

Financial Services US

PC Progressive Corp logo Broad data Nov 5, 2026

Progressive Corp

PGR · US
Solid, but expensive

Our calculation puts a fair price 32% below what the stock costs today.

Quality 67/100
Solidly profitable · 12.7% net margin (TTM)
Low debt
Generates free cash flow
Wide moat 73/100
Positive coverage
Broad data
Mixed Growth (revenue 5y +15.5 %/yr in USD)
Insiders sold $26.6M (6M)
Fair value $160.75 · Overvalued (−31.5%)
Trails peers (5/15)

Risks from the AI analysis

🚩AI shopping agents erode retention edge🚩State rules limit telematics data use

What runs behind every stock

69 individual criteria per stock, every one traceable See the method →

Price vs Fair Value

$273.12 $80.58 Fair Value $160.75 Aug 2021 Nov 2026

White line = price, green steps = our fair value per fiscal year. As of Nov 5, 2026.

How to read this chart

60‑month range $80.58 – $273.12 · fair‑value band $120.56 – $200.94 · the $234.82 price screens above the $160.75 fair value. Green steps = our fair value per fiscal year (point-in-time, no hindsight). As of Nov 5, 2026.

Follow Progressive in your weekly email

Every Wednesday you see whether Progressive is on track or worth a review, plus price against fair value. Free, up to 3 stocks.

We send you a confirmation link. Unsubscribe with one click.

Which stocks are undervalued right now? Check free Discover now →

Company profile

The Progressive Corporation operates as an insurance company in the United States. It writes insurance for personal autos and special lines products, including motorcycles, RVs, and watercraft; and personal residential property insurance for homeowners and renters.

Show moreShow less

The company also writes auto-related liability and physical damage insurance for comprising dump trucks, log trucks, garbage trucks, tractors, trailers, straight trucks, tow trucks and wreckers, vans, pick-up trucks, and autos; business-related general liability and commercial property insurance for small businesses; and workers' compensation insurance for the transportation industry.

In addition, it offers other specialty property-casualty insurance and provides related services; personal property reinsurance products; and involved in investment activities. It sells its products through independent insurance agencies, as well as online and over the phone.

The Progressive Corporation was founded in 1937 and is headquartered in Mayfield, Ohio.

Stock analysis

Progressive Corp (PGR) currently trades at $234.82, while our model-based Fair Value estimate is $160.75, 32% below the price, so the stock looks overvalued today.

Show more

Valuation

Bull case: the Economic Profit group reads highest at a median of $184.82 per share, and 1 of the 6 models we run sit above the $234.82 price.

Bear case: the Asset-Based group reads lowest at $32.64, and 5 of the 6 models stay below the price. Data coverage for this calculation is high.

Scenario range: $120.56 (bear) to $200.94 (bull), the price of $234.82 sits above it. Bear and bull are the same models on cautious and optimistic assumptions, a range, not a price target.

Quality & growth

The Quality Score stands at 67/100 (solid quality), in the Financial Services sector.

Mixed Growth: Revenue is growing, but margins or cash flow do not fully confirm the trend.

Progressive Corp reported revenue of $87.6B in FY2025 versus $47.7B in FY2021, a compound +16.4%/yr. Reported net income was $11.3B in FY2025, compounding +35.5%/yr from FY2021.

Key figures

Market cap $137B Large · P/E ratio 11.8 · P/S ratio 1.50 · EPS (TTM) $19.85 · Dividend yield 0.0% · Net margin 12.7% · Return on equity 33.2% · Return on assets (EBIT) 6.9%.

Competitive moat

Our AI-assisted moat analysis scores the competitive advantage at 73 out of 100 (medium confidence).

What moves the price

The share trades at its 52-week high and 23% above its 52-week low, currently above its 200-day average.

For context, the median of 10 Financial Services peers we cover trades at −24% fair-value upside, at −32%, PGR screens richer than that median.

Fair Value models

Bear $120.56 Fair Value $160.75 Bull $200.94
Price $234.82 · Downside -31.5%
Model ⓘEach model values the company its own way (discounted cash flow, earnings, assets, dividends). The fair value above starts from their evidence-weighted blend, not from a single model. In cyclical trough or peak years, after dilution or a stock split it is adjusted afterwards, so it can sit above or below the models. Based on fiscal year 2025 figures (about 10 months old). Earnings retained since then ($16.72 per share) are deliberately not added. Bear ⓘBear = the cautious scenario: the same model computed with conservative anchors (lower growth, margins and valuation multiples). Together with Bull it frames a plausible valuation range, not a price target.BaseBull ⓘBull = the optimistic scenario: the same model computed with favourable anchors (higher growth, margins and valuation multiples). Together with Bear it frames a plausible valuation range, not a price target. If a model's bull case is above four times its base value, the table shows that limit with a > sign (like the overall Bull above): beyond it no assumption holds. Coverage ⓘCoverage = how well-backed THIS model's estimate is for this stock (0–100): how complete and reliable its input data are, and how well the model fits the company. The final Fair Value is an evidence-weighted blend, so better-evidenced models count more. Green ≥70, amber 50–69, grey below 50.
Best data coverage
Residual Income $125.65 $184.82 $430.72 69
DDM Multi-Stage $49.58 $90.33 $117.42 66
Gordon GGM $49.58 $113.50 $203.53 65
All 6 models by family
Dividend Discount
Gordon GGM $49.58 $113.50 $203.53 65
DDM Multi-Stage $49.58 $90.33 $117.42 66
Multiples
P/E Multiple $189.96 $253.28 $316.60 63
P/B Multiple $51.16 $68.21 $85.27 55
Asset-Based
NCAV (Graham) $24.36 $32.64 $48.72 54
Economic Profit
Residual Income $125.65 $184.82 $430.72 69

Open the full fair value analysis →

Quality Score breakdown

Overall quality 67/100

It rates the business: profits, how they develop, real cash, balance sheet, investing and share count.

Profitability 61
How much profit the company makes from its sales and capital
Quality Growth 64
Are margins and returns getting better?
Cashflow 81
Do the profits arrive as real cash?
Financial strength 54
Debt, balance sheet and risk of trouble
Investment 37
Does it invest with discipline instead of growing at any price?
Low Volatility 87
How calm the share price moves, does not count
Price momentum 57
Price momentum of the last 3 to 12 months, does not count
Near the 52-week high 79
Distance to the 52-week high, does not count
New shares 86
Buys back shares or issues new ones?

Open the full quality analysis →

Insider trades

In the last 6 months, 8 officers or directors sold shares worth $26.6M and none bought.

  • SaleSteven BrozChief Information Officer9× since Nov 11, 2025: 11,179 shares, avg. $214.97$2.4MOct 22, 202610b5-1 plan
  • SaleSusan Patricia GriffithPresident and CEO, Director2× since Jul 27, 2026: 74,676 shares, avg. $216.11$16.1MSep 1, 202610b5-1 plan
  • SaleLori A NiederstChief Personal Lines Officer7,339 shares at $209.29$1.5MAug 13, 202610b5-1 plan
  • SaleAndrew J QuiggVP and Chief Financial Officer2× since Jan 21, 2026: 5,148 shares, avg. $214.99$1.1MJul 28, 202610b5-1 plan
  • SaleKaren BailoCommercial Lines President2× since Mar 5, 2026: 11,969 shares, avg. $212.50$2.5MJul 27, 202610b5-1 plan
  • SaleJonathan S. BauerChief Investment Officer3× since Jan 21, 2026: 7,613 shares, avg. $206.43$1.6MJul 27, 202610b5-1 plan
  • SaleJohn Jo MurphyClaims President2× since Jun 5, 2026: 14,040 shares, avg. $207.35$2.9MJul 27, 202610b5-1 plan
  • SaleJeffrey D KellyDirector7,000 shares at $216.33$1.5MJun 24, 2026
  • SaleDevin C JohnsonDirector980 shares at $203.10$199,038Apr 16, 2026
  • SaleCarl G JoyceChief Accounting Officer2× since Mar 5, 2026: 411 shares, avg. $208.39$85,647Mar 20, 2026

Plus 2 more entries from the last 12 months.

Plus 26 other filings such as grants, option exercises or tax withholding. They are not market purchases or sales.

Sales are often planned (taxes, diversification, 10b5-1 plans). Purchases with their own money are seen as the stronger sign. For information only: not part of the quality score or Fair Value.

Source: SEC Form 4, as of Nov 5, 2026. All filings at the SEC ↗

Revenue & earnings trend

Growth Quality ⓘGrowth is valuable only when reinvestment earns attractive returns (Aswath Damodaran): sustainable growth depends on return on capital, reinvestment and efficiency. Basis: total company revenue over the periods shown on the cards (3Y/5Y/all years), not per share, so a merger can show up as a growth jump; per-share earnings growth is in the value-creation card. 92/100
Revenue is growing, but margins or cash flow do not fully confirm the trend.
Revenue growth 1 year
+16.3%
Revenue growth 3 years ⓘMeasures the company's TOTAL revenue from reported annual statements: compound average growth per year (CAGR) from the fiscal year 3, 5 or N years back to the most recent comparable fiscal year. Not per share: buybacks do not change this number, and a merger can appear as a growth jump. Per-share growth (which does include buybacks) is in the value-creation card.
+20.9%
Revenue growth 5 years ⓘMeasures the company's TOTAL revenue from reported annual statements: compound average growth per year (CAGR) from the fiscal year 3, 5 or N years back to the most recent comparable fiscal year. Not per share: buybacks do not change this number, and a merger can appear as a growth jump. Per-share growth (which does include buybacks) is in the value-creation card.
+15.5%
Start year 2020 (pandemic). Over 10 years: +15.5% a year
Revenue growth 40 years ⓘMeasures the company's TOTAL revenue from reported annual statements: compound average growth per year (CAGR) from the fiscal year 3, 5 or N years back to the most recent comparable fiscal year. Not per share: buybacks do not change this number, and a merger can appear as a growth jump. Per-share growth (which does include buybacks) is in the value-creation card.
+13.8%
What shareholders gained per year (last 5 years) (mathematically smoothed) ⓘWhat the business itself delivers per year: earnings growth per share plus the dividend yield. This is what you get IF the market keeps valuing the stock the same way: it contains no assumption about the market changing its mind. Computed per share, so buybacks count and a merger does not pass as growth. For a company that pays no dividend it is pure earnings growth per share. Period: earnings growth per share as CAGR over the last 5 reported fiscal years (annual statements), plus the current dividend yield. The start value is the median of the three years around the start, so a single crisis year (a pandemic or a write-down) does not distort the rate. Smoothed = median of all growth paths between the years of the window (trend line on the logarithm of earnings per share): a single extreme year cannot distort the rate. The reported figure stays in the tooltip.
+33.2%
Earnings growth per share plus dividend.
Earnings per share, growth per year+33.2%
Dividend (yield on the price)0.0%
Pace: 5 vs 10 years ⓘTwo data points, not a trend model: earnings growth per share over the last 5 fiscal years against the last 10. Labelled "steady" when both rates are within 3 percentage points of each other, otherwise picking up or flattening. Shown only when ten years of history exist.23.2% vs 24.5%, steady
Profit margin 2020 to 2025 ⓘOperating margin then vs now, from reported annual statements. A falling margin after a boom year is the classic peak-earnings signal: the growth rate then leans on an inflated base.17% → 16%
2025 sits 189% above its own trend. The rate follows the median trend of the last 5 years, not that single year.
Pace: the 5-year rate starts in 2020 (pandemic)

Growth Forecast

Little optimism in the price
The price assumes less growth than the company has delivered so far and less than analysts expect.
What the price assumes ⓘThis turns our valuation around: instead of asking what the share is worth, it asks what growth the current price requires. It uses the cash the company keeps after all spending (free cash flow), the same discount rate as our models, five years of growth, then slowing evenly to 2 % a year by year ten. Compared with the analysts' sales forecasts extended to the same five years (at least three analysts, for context only, it does not enter the Fair Value): within 3 percentage points counts as "in line" (amber), below that little optimism (green), above that a lot of optimism (red).
−12.3%
The company could shrink this much every year for the next five years and today's price would still be justified.
What forecasts expect ⓘAnalysts publish sales forecasts for the next two fiscal years. For the years after that, growth slows evenly to 2 % a year by year ten (2 % is the long-run rate our models use). Projected years are marked as such.
+3.6%
Yearly sales growth analysts expect, extended to five years.
After inflation (USA: IMF forecast 2.4% a year to 2030, 3.1% from 2016 to 2025) that is about −14.4% a year for the price and +1.2% for the forecasts.
Forecast 2026 (sales)−0.6%
Forecast 2027 (sales)+5.3%
Projected 2028 (sales)+4.9%
Projected 2029 (sales)+4.5%
Projected 2030 (sales)+4.1%

PGR screens overvalued: fair value 32% below the price. Compare with Chubb Limited →

Recent news

News mood ⓘNews mood, the average tone of recent news (100 articles), rated against how stocks are usually covered. 🚀 Hype = unusually upbeat · 🙂 Positive = above average · 😐 Neutral = typical · 🙁 Negative = below average · 😨 Very negative = unusually downbeat. It reflects the tone of coverage, not our valuation. Positive
Recent news coverage is more positive than average.
Note from the team Oct 29, 2026
AI conclusion: Progressive shows a moderate moat through its underwriting edge and profitability metrics, yet limited public signals and cyclical industry risks leave its long-term persistence uncertain.
Main risk: Generative AI chatbots or agents could make policy comparison and switching easier, reducing customer stickiness and Progressive's direct marketing advantage in personal lines.
Bull case: Progressive could integrate generative AI into its underwriting and customer tools faster than rivals, using its vast proprietary driving data to keep a pricing and service lead even as shopping becomes easier.
Bear case: Widespread AI agents could commoditize insurance quotes and accelerate switching, while regulatory curbs on data collection erode Progressive's segmentation advantage and compress margins across personal auto lines.
Progressive has sharpened its underwriting edge, lifting the combined ratio in recent months. Yet it has also cut auto rates across most of its book and increased advertising spend. Will these steps keep policies growing without squeezing the margins that have driven its results?
Join the discussion →

Compare Progressive Corp with another stock

Price, fair value, quality and upside side by side.

Free, no sign-up

Peer GroupⓘHow this stock ranks against its industry: the green marker is this stock, the band is the typical 25–75% peer range, and the tick is the median.Insurance - Property & Casualty · 100 stocks

Beats the industry median on 5/15 measures
Overall it trails its industry peers.
Valuation
Quality Score 67 · Above median
Fair Value upside −31.5% · Below median
Profitability
Return on equity (12 months) 33.2% · Top 25%
Return on assets 9.2% · Top 25%
Net margin (12 months) 12.7% · Above median
Operating margin (12 months) 14.3% · Below median
Growth and dividend
Revenue growth (quarter YoY) 3.0% · Below median
Dividend yield (12 months) 0.0% · Bottom 25%
Balance sheet
Debt / equity 0.23× · Above median

Valuation Multiplesvs Insurance - Property & Casualty median · lower = cheaper

P/E (12 months) 11.8× · Pricier than median
P/B 4.52× · Priciest 25%
P/S (12 months) 1.50× · Pricier than median
Price / free cash flow 8.0× · Cheaper than median
EV/EBITDA 9.4× · Pricier than median
PEG 63.46× · Priciest 25%

Strength profile in five axes (Snowflake)

VALUEFUTUREPASTHEALTHDIVIDEND
This stock
VALUEFUTUREPASTHEALTHDIVIDEND
Sector peers
VALUE (fair-value potential)0 · sector 7
FUTURE (revenue growth)15 · sector 26
PAST (return on equity)100 · sector 62
HEALTH (low debt)89 · sector 90
DIVIDEND (yield)1 · sector 47

VALUE 0: the price sits above our fair-value range.

Context: sector, industry, market

Values & ESG

Does this company touch areas you may want to avoid? The classification is inferred from sector and industry.

None of the checked exposures detected

Similar stocks

10 more Insurance - Property & Casualty stocks, each showing price versus our Fair Value estimate.

Stock Price Fair Value vs Fair Value Compare
The People's Insurance Company 601319 ¥7.41 ¥9.01 +22% vs PGR
PICC Property and Casualty Company 2328 HK$17.30 HK$19.09 +10% vs PGR
The Allstate Corporation ALL $269.06 $290.52 +8% vs PGR
Fairfax Financial Holdings FFH C$2,755 C$2,933 +6% vs PGR
Cincinnati Financial Corporation CINF $190.48 $144.19 −24% vs PGR
Chubb Limited CB $374.17 $235.99 −37% vs PGR
The Travelers Companies, Inc TRV $409.25 $254.84 −38% vs PGR
Intact Financial Corporation IFC C$282.02 C$167.88 −40% vs PGR
W. R. Berkley Corporation WRB $76.71 $43.28 −44% vs PGR
QBE Insurance Group QBE A$25.89 A$13.41 −48% vs PGR

Explore undervalued stocks

More undervalued Financial Services stocks →

Try a ready-made strategy

Pick a strategy and jump into the live analysis with that exact screen applied.

🥇 Backtested Best 🏆 Big Names 💎 Quality on Sale 🚀 Profitable Growth 🧊 Quality Compounders 💵 Dividend Stars 📈 Strong Momentum 📉 Fallen Angels ⚖️ Deeply Undervalued 🔍 Small-Cap Gems 🏰 Moat at a Fair Price 💼 Insider Buying 🎩 Buffett-Style Quality 📚 Peter Lynch GARP 🧮 Greenblatt Magic Formula 🛡️ Graham Defensive

Discover tools

For bloggers & editors: embed code + live data

For bloggers, editors and developers: paste this into your site or blog (a “Custom HTML” block in WordPress), it shows the current fair value and links back here. Free, plain HTML, and welcome. Full data streams (CSV/JSON) at /developers.
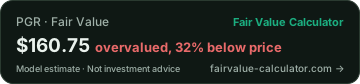
Progressive Corp: fair value per Fair Value Calculator

Cite: Fair Value Calculator (2026). "Progressive Corp Fair Value". https://www.fairvalue-calculator.com/stock/PGR

Frequently asked questions

Is Progressive Corp (PGR) overvalued or undervalued?
As of Nov 5, 2026, our model estimates a fair value of $160.75 versus a price of $234.82, about 32% lower (overvalued).
What is the fair value of PGR?
Our model-based fair value for Progressive Corp is $160.75 (as of Nov 5, 2026), built from audited fundamentals. The current price: $234.82.
What is the quality score of PGR?
Progressive Corp has a Quality Score of 67/100. It measures business quality (profitability, growth, cash flow, balance-sheet strength, investment discipline, share issuance). Market factors such as price momentum and volatility do not enter the number; they are shown separately in the detail view.
What is the price target for Progressive Corp (PGR)?
Our model-based price target is the fair value of $160.75 (as of Nov 5, 2026) from 6 valuation models. Cautious scenario $120.56, optimistic scenario $200.94. It is a calculation from audited fundamentals, not an analyst target.
What is the Progressive Corp stock forecast for 2026?
Our models put fair value at $160.75, about 32% lower versus a price of $234.82 (overvalued). Cautious scenario $120.56, optimistic scenario $200.94. The calculation is refreshed regularly with new filings.
What is the revenue of Progressive Corp (PGR)?
Progressive Corp reported trailing-twelve-month revenue of about $91.7B (latest available figure, as of Nov 5, 2026).
Does Progressive Corp pay a dividend?
Progressive Corp currently shows a dividend yield of 0.04% relative to its recent price (as of Nov 5, 2026).
What growth is priced into Progressive Corp (PGR)?
For today's price to be fair in a discounted-cash-flow model, Progressive Corp would have to grow free cash flow by -12.3 % per year for five years (discount rate 8.1 %, then slowing evenly to 2 % perpetual growth by year ten). Over the last 5 years revenue grew +15.5 % per year. As of Nov 5, 2026.
What discount rate (WACC) does the fair value of PGR use?
Our models discount Progressive Corp at 8.1 %: a base by market capitalisation (large), damped by beta 0.24, country premium for USA. The same rate applies in all 26 models.
What is a reverse DCF?
A reverse DCF turns the usual calculation around. Instead of deriving a value from assumptions, it takes today's price as given and asks: what free-cash-flow growth would a company have to deliver for exactly this price to be fair? The result is not a forecast but the expectation already priced in. For Progressive Corp that is -12.3 % per year a year over ten years, using the same discount rate (8.1 %) and the same formula as our fair value.
How much growth has Progressive Corp (PGR) delivered so far?
Over the past 5 years revenue at Progressive Corp grew +15.5 % a year. The price currently implies -12.3 % per year free-cash-flow growth a year. Comparing the two shows how much confidence is in the price: if it demands more than has been delivered, the business has to accelerate for the maths to work.
How fast is the sector of Progressive Corp (PGR) growing?
The median revenue growth in the sector is +9.4 % a year. That is the yardstick for the growth priced into Progressive Corp (-12.3 % per year a year): it shows whether the expectation is within the usual range or beyond it.
What is the free cash flow yield of Progressive Corp (PGR)?
The free-cash-flow yield on the price is 12.54 %: that much free cash flow Progressive Corp produces per unit of market value. When it exceeds the discount rate of our models (8.1 %), the business already earns more than its cost of capital demands, and the price needs little additional growth.
What is the intrinsic value of Progressive Corp (PGR)?
Intrinsic value and fair value mean the same thing: what the business is worth on its numbers, independent of the share price. For Progressive Corp it is $160.75 per share (as of Nov 5, 2026), against a price of $234.82. It is the blended result of 6 valuation models (cash flow, earnings, asset, dividend).
Is Progressive Corp stock overvalued or undervalued in 2026?
As of Nov 5, 2026, PGR trades above its calculated fair value: price $234.82, fair value $160.75, a gap of about −32% (overvalued). The calculation is refreshed with each new quarterly report, so the verdict can change during the year.
Is fair value the same as the market price of PGR?
No. The price is what the market pays today ($234.82); the fair value is what the company's own numbers justify ($160.75). For Progressive Corp the two are $74.07 per share apart. That gap is exactly why we show both numbers side by side.
How much is Progressive Corp worth?
The market values Progressive Corp at about $137B (market capitalisation, as of Nov 5, 2026). Per share that is $234.82; our models calculate a fair value of $160.75 per share.
What do the bullish and bearish scenarios say about PGR?
Our models span a range for Progressive Corp: cautious scenario $120.56, base $160.75, optimistic $200.94 per share (as of Nov 5, 2026, price $234.82). The range comes from different growth and margin assumptions, not from analyst opinions.
What is the P/E ratio of PGR?
Progressive Corp trades at a price-to-earnings ratio of 11.8 (as of Nov 5, 2026). A P/E on its own says little: it compares the price with ONE year of profit, while our fair value of $160.75 is built from several models across several years. Median P/E at fiscal year-end, 10 fiscal years (2016 to 2025), reported earnings, FY2022, FY2023 ex one-offs: 17.3. Other multiples: PEG 63.5, P/B 4.5, P/S 1.5, EV/EBITDA 9.4.
What is the PEG ratio of PGR?
The PEG ratio of Progressive Corp is 63.46 (P/E divided by earnings growth, as of Nov 5, 2026). That is above 1, so the growth is already paid for in the price.
How solid is the balance sheet of Progressive Corp (PGR)?
Balance-sheet figures for Progressive Corp (as of Nov 5, 2026): return on equity 33.2%, debt of 0.23 per unit of equity. They feed the Quality Score of 67/100, which measures business quality independently of the share price.
How far is PGR from its 52-week high?
Progressive Corp trades at $234.82, at its 52-week high of $234.82 and 23% above the low of $190.22 (as of Nov 4, 2026). Distance from the high says nothing about value: that is what the fair value of $160.75 is for.
Which stocks are comparable to Progressive Corp?
From the same area (Financial Services) we also value Chubb Limited, The Travelers Companies, Inc, The Allstate Corporation, The People's Insurance Company, among others. Each of them has its own fair-value calculation on this site using the same models, so the comparison is like for like.
Is Progressive Corp stock attractive at the current price?
The data as of Nov 5, 2026: price $234.82, calculated fair value $160.75 (−32%), Quality Score 67/100, from 6 models. Whether that fits your horizon and risk tolerance is your call. We provide the calculation, not investment advice.
How is the fair value of PGR calculated?
We run Progressive Corp through 6 models from four families: discounted cash flow, earnings models, asset and balance-sheet models, and dividend models. Every model gets the same audited fundamentals; the result is the weighted average of $160.75, with the spread shown as a cautious and an optimistic scenario.
Is it still worth investing in stocks now?
The global stock market currently sits 15.5% above its aggregate fair value. Progressive Corp itself currently trades above fair value. An expensive market is no reason to stay out and no reason to buy everything at once: keep a broad savings plan running, buy single stocks only with money you can do without, and hold part of your money liquid while the market is high. The full picture including sectors is on is it worth investing now.
What is the share price of Progressive Corp (PGR)?
The closing price on Nov 4, 2026 was $234.82. Our model-based fair value is $160.75, about 32% lower (overvalued). We carry closing prices from our data provider, not a live tick.
What should I pay attention to with Progressive Corp right now?
The price sits above even our optimistic bull case ($200.94). The favourable scenario is already priced in. Solid but not exceptional quality (67/100) and above fair value, neither a clear bargain nor a standout compounder. For a financial, book-value and earnings-based methods matter more than a cash-flow DCF, which fits banks and insurers poorly.
Where does the earnings growth of Progressive Corp (PGR) come from?
Earnings per share at Progressive Corp grew +23.4 % a year from 2014 to 2025. Broken into its drivers: revenue per share +15.1 %, EBIT margin +5.3 %, tax rate +1.7 %, residual (interest, one-offs) +0.1 %. The four rates multiply to the earnings growth rate, they do not add up. Start and end are three-year averages so a single exceptional year does not distort the result.

Key figures of Progressive Corp

How large is the market capitalisation of Progressive Corp (PGR)?
The market capitalisation of Progressive Corp is $137B. The stock-market value of the whole company: share price times number of shares. It is what the market asks for the entire business today.
What is the P/S ratio of Progressive Corp (PGR)?
The price-to-sales ratio of Progressive Corp is 1.50 (last twelve months). Price to sales: market value relative to yearly revenue. Useful when profit is thin or distorted.
What are the earnings per share of Progressive Corp (PGR)?
Earnings per share at Progressive Corp are $19.85 (price ÷ EPS = P/E 11.8). Earnings per share over the last twelve months: total profit spread across every single share.
What is the dividend yield of Progressive Corp (PGR)?
The dividend yield of Progressive Corp is 0.0% (payout 0.5%). Yearly dividend relative to the share price. 3% pays 3 per 100 invested. Below: how much of profit is used for it.
What is the net margin of Progressive Corp (PGR)?
The net margin of Progressive Corp is 12.7% (last twelve months). How much of every unit of revenue ends up as profit. 10% means 10 cents of profit per dollar of sales.
What is the return on equity of Progressive Corp (PGR)?
The return on equity (ROE) of Progressive Corp is 33.2% (last twelve months). Profit relative to shareholders' equity, how efficiently the company works with its owners' money.
What is the EBIT return on assets of Progressive Corp (PGR)?
On an EBIT basis the return on assets of Progressive Corp is 6.9% (avg 5y). Operating profit (EBIT) relative to everything the company owns, as a multi-year average. It describes the business model rather than one good or bad year.
What is the operating margin of Progressive Corp (PGR)?
The operating margin of Progressive Corp is 14.3% (last twelve months). Profit from the core business (before interest and taxes) relative to revenue.
How fast is revenue growing at Progressive Corp (PGR)?
Revenue at Progressive Corp is growing +3.0% versus a year earlier (3y avg +20.9%). How much revenue grew versus a year earlier (YoY). The 3-year average next to it puts the single year in context.
How fast are earnings growing at Progressive Corp (PGR)?
Earnings per share at Progressive Corp are growing −2.1% versus a year earlier. How much earnings per share grew versus a year earlier.
How much net debt does Progressive Corp (PGR) carry?
The net debt of Progressive Corp is $6.8B (fiscal year 2025, ≈ 0.4 yrs of FCF). Debt minus cash on hand. The note shows how many years of free cash flow could in theory pay it off.
Free · no account needed

Watch Progressive Corp in the live analysis

One click puts Progressive Corp on your watchlist: fair value and trend at a glance, plus comparison, the diversification check and the 27,000+ stock screener.

Watch for free →

Zero risk: nothing is ever charged. Your watchlist is yours, with or without an account.