EN DE
Watch Enel Generacion Costanera SA for free: we tell you when fair value or trend changes.
Data-driven stock valuation

Enel Generacion Costanera SA (CECO2) fair value: what the stock is really worth

As of Nov 13, 2026: fair value (intrinsic value) of Enel Generacion Costanera SA stock ARS 451, price ARS 410, upside +10.0%, quality 54 out of 100. Rating: fairly valued. Calculated from audited financials with 24 of our 26 valuation models and 37 quality factors, updated daily.

  1. Keep an eye on it?Free in your watchlist: 5 stocks without an account, 10 with one Yes, for free

Utilities AR · ISIN ARP2341J1058

EG Enel Generacion Costanera SA logo Thin data Nov 14, 2026

Enel Generacion Costanera SA

CECO2 · BA

Solid company and rising price, but the stock is already about fairly priced: meets 2 of 3 rules.

Get notified free when this changes
Rising price (uptrend) 
Healthy Growth (revenue 5y +77.1 %/yr in ARS) 
Highly profitable · 20.1% net margin (TTM) 
Low debt 
Generates free cash flow 
Ranks above peers (12/13) 
Wide moat 68/100
Costs just 4.3 times its yearly profit. 
Fair value 451.00 ARS · Fairly valued 
Quality 54/100 
Thin data 
Quality growth
Watch Enel Generacion Costanera SA for free: we tell you when fair value or trend changes. Watch for free

What runs behind every stock

69 individual criteria per stock, every one traceable See the method →

Price vs Fair Value

628.00 ARS 16.70 ARS Fair Value 451.00 ARS May 2021 Nov 2026

White line = price, green steps = our fair value per fiscal year. As of Nov 14, 2026.

How to read this chart

60‑month range 16.70 ARS – 628.00 ARS · fair‑value band 280.82 ARS – 622.97 ARS · the 410.00 ARS price screens below the 451.00 ARS fair value. Green steps = our fair value per fiscal year (point-in-time, no hindsight). 1 fiscal year is left out: there the valuation rested on only a fraction of the usual models. As of Nov 14, 2026.

Follow Enel Generacion Costanera in your weekly email

Every Wednesday you see whether Enel Generacion Costanera is on track or worth a review, plus price against fair value. Free, up to 3 stocks.

We send you a confirmation link. Unsubscribe with one click.

Which stocks are undervalued right now? Check free Discover now →

Company profile

Central Costanera S.A. generates, transports, trades, and distributes electrical energy in Argentina.

Show moreShow less

It owns and operates four conventional turbo steam units with an installed capacity of 661 MW; two cycles energy plant with an installed capacity of 851 MW; a gas turbine; and a BTH steam turbine with an installed capacity of 277 MW. The company provides engineering, consultancy, and management services for operation of electrical power plants.

The company was formerly known as Enel Generación Costanera S.A. and changed its name to Central Costanera S.A. in March 2023. The company was incorporated in 1992 and is based in Buenos Aires, Argentina. The company operates as a subsidiary of Enel Argentina S.A.

Stock analysis

Enel Generacion Costanera SA (CECO2) currently trades at 410.00 ARS, while our model-based Fair Value estimate is 451.00 ARS, so the stock looks roughly fairly valued today (gap 9.1%).

Show more

Valuation

Bull case: the Growth Earnings group reads highest at a median of 592.88 ARS per share, and 8 of the 24 models we run sit above the 410.00 ARS price.

Bear case: the Economic Profit group reads lowest at 81.66 ARS, and 16 of the 24 models stay below the price. Data coverage for this calculation is low.

Scenario range: 280.82 ARS (bear) to 622.97 ARS (bull), the price of 410.00 ARS sits inside it. Bear and bull are the same models on cautious and optimistic assumptions, a range, not a price target.

Quality & growth

The Quality Score stands at 54/100 (solid quality), in the Utilities sector.

Healthy Growth: Revenue growth appears healthy and is supported by profitability and cash-flow quality.

Enel Generacion Costanera SA reported revenue of 161B ARS in FY2025 versus 10.5B ARS in FY2021, a compound +97.9%/yr. Reported net income was 9.8B ARS in FY2025.

Key figures

Market cap 294B ARS (≈ $191M) Micro · P/E ratio 4.3 · P/S ratio 0.93 · EPS (TTM) 95.26 ARS · Net margin 20.1% · Return on equity 31.4% · Return on assets (EBIT) −1.3% (5-year average) · Operating margin 28.6%.

Competitive moat

Our AI-assisted moat analysis scores the competitive advantage at 68 out of 100 (medium confidence).

What moves the price

The share trades about 27% below its 52-week high and 17% above its 52-week low, currently below its 200-day average.

For context, the median of 10 Utilities peers we cover trades at −39% fair-value upside, at 10%, CECO2 screens cheaper than that median.

Fair Value models

Bear 280.82 ARS Fair Value 451.00 ARS Bull 622.97 ARS
Price 410.00 ARS · Upside +10.0%
Model ⓘEach model values the company its own way (discounted cash flow, earnings, assets, dividends). The fair value above starts from their evidence-weighted blend, not from a single model. In cyclical trough or peak years, after dilution or a stock split it is adjusted afterwards, so it can sit above or below the models. Based on fiscal year 2025 figures (about 10 months old). Earnings retained since then (82.99 ARS per share) are deliberately not added. Bear ⓘBear = the cautious scenario: the same model computed with conservative anchors (lower growth, margins and valuation multiples). Together with Bull it frames a plausible valuation range, not a price target.BaseBull ⓘBull = the optimistic scenario: the same model computed with favourable anchors (higher growth, margins and valuation multiples). Together with Bear it frames a plausible valuation range, not a price target. If a model's bull case is above four times its base value, the table shows that limit with a > sign (like the overall Bull above): beyond it no assumption holds. Coverage ⓘCoverage = how well-backed THIS model's estimate is for this stock (0–100): how complete and reliable its input data are, and how well the model fits the company. The final Fair Value is an evidence-weighted blend, so better-evidenced models count more. Green ≥70, amber 50–69, grey below 50.
Best data coverage
FCF DCF 174.42 ARS 228.46 ARS 379.73 ARS 79
Growth DCF 162.64 ARS 236.79 ARS 355.83 ARS 78
EPV 32.25 ARS 38.79 ARS 43.67 ARS 74
All 24 models by family
DCF Models
FCF DCF 174.42 ARS 228.46 ARS 379.73 ARS 79
Owner Earnings 41.15 ARS 104.80 ARS 196.15 ARS 72
5Y Revenue Exit 170.85 ARS 299.01 ARS 563.90 ARS 69
5Y EBITDA Exit 333.04 ARS 624.59 ARS 1,195 ARS 71
5Y P/E Exit 144.92 ARS 313.03 ARS 527.69 ARS 68
10Y Revenue Exit 162.80 ARS 323.18 ARS 400.56 ARS 67
10Y EBITDA Exit 233.50 ARS 518.86 ARS 998.44 ARS 64
10Y P/E Exit 155.46 ARS 291.90 ARS 489.01 ARS 62
Earnings-Based
Graham-Dodd 95.01 ARS 662.62 ARS 929.88 ARS 63
Lynch FV 330.07 ARS 471.53 ARS 612.98 ARS 61
PEG = 1.0 330.07 ARS 471.53 ARS 612.98 ARS 57
EPV 32.25 ARS 38.79 ARS 43.67 ARS 74
Multiples
P/E Multiple 188.63 ARS 251.51 ARS 314.39 ARS 63
P/S Multiple 178.15 ARS 237.54 ARS 296.92 ARS 58
P/B Multiple 359.92 ARS 479.89 ARS 599.86 ARS 55
EV/EBIT 216.51 ARS 312.28 ARS 408.05 ARS 65
EV/EBITDA 555.91 ARS 764.82 ARS 973.72 ARS 67
EV/Revenue 161.60 ARS 261.20 ARS 360.80 ARS 53
Asset-Based
NCAV (Graham) 3.24 ARS 4.91 ARS 6.13 ARS 55
Growth DCF
Growth DCF 162.64 ARS 236.79 ARS 355.83 ARS 78
Rev-Margin DCF 192.25 ARS 350.27 ARS 682.05 ARS 69
Economic Profit
Residual Income 117.77 ARS 124.52 ARS 140.11 ARS 71
ROIC Compounder 32.25 ARS 38.79 ARS 43.67 ARS 72
Growth Earnings
Growth-Adj P/E 415.01 ARS 592.88 ARS 770.74 ARS 67

Open the full fair value analysis →

Quality Score breakdown

Overall quality 54/100

It rates the business: profits, how they develop, real cash, balance sheet, investing and share count.

Profitability 30
How much profit the company makes from its sales and capital
Quality Growth 62
Are margins and returns getting better?
Cashflow 70
Do the profits arrive as real cash?
Financial strength 57
Debt, balance sheet and risk of trouble
Investment 9
Does it invest with discipline instead of growing at any price?
Low Volatility 73
How calm the share price moves, does not count
Price momentum 52
Price momentum of the last 3 to 12 months, does not count
Near the 52-week high 50
Distance to the 52-week high, does not count
New shares 82
Buys back shares or issues new ones?

Open the full quality analysis →

Revenue & earnings trend

Growth Quality ⓘGrowth is valuable only when reinvestment earns attractive returns (Aswath Damodaran): sustainable growth depends on return on capital, reinvestment and efficiency. Basis: total company revenue over the periods shown on the cards (3Y/5Y/all years), not per share, so a merger can show up as a growth jump; per-share earnings growth is in the value-creation card. 100/100
Revenue growth appears healthy and is supported by profitability and cash-flow quality.
Revenue growth 1 year
+46.2%
Revenue growth 3 years ⓘMeasures the company's TOTAL revenue from reported annual statements: compound average growth per year (CAGR) from the fiscal year 3, 5 or N years back to the most recent comparable fiscal year. Not per share: buybacks do not change this number, and a merger can appear as a growth jump. Per-share growth (which does include buybacks) is in the value-creation card.
+114.5%
Revenue growth 5 years ⓘMeasures the company's TOTAL revenue from reported annual statements: compound average growth per year (CAGR) from the fiscal year 3, 5 or N years back to the most recent comparable fiscal year. Not per share: buybacks do not change this number, and a merger can appear as a growth jump. Per-share growth (which does include buybacks) is in the value-creation card.
+77.1%
Start year 2020 (pandemic). Over 10 years: +60.6% a year
Revenue growth 10 years ⓘMeasures the company's TOTAL revenue from reported annual statements: compound average growth per year (CAGR) from the fiscal year 3, 5 or N years back to the most recent comparable fiscal year. Not per share: buybacks do not change this number, and a merger can appear as a growth jump. Per-share growth (which does include buybacks) is in the value-creation card.
+60.6%
What shareholders gained per year (last 5 years), in ARS ⓘWhat the business itself delivers per year: earnings growth per share plus the dividend yield. This is what you get IF the market keeps valuing the stock the same way: it contains no assumption about the market changing its mind. Computed per share, so buybacks count and a merger does not pass as growth. For a company that pays no dividend it is pure earnings growth per share. Period: earnings growth per share as CAGR over the last 5 reported fiscal years (annual statements), plus the current dividend yield. The start value is the median of the three years around the start, so a single crisis year (a pandemic or a write-down) does not distort the rate. Basis: EBIT basis. Measured in ARS: this currency has depreciated against the euro and dollar over the long run, so part of the nominal rate is currency erosion that never reaches a EUR/USD investor.
≈ +47.3%
Earnings growth per share plus dividend.
Earnings per share, growth per year+47.3%
Dividend (yield on the price)0.0%
Profit margin 2020 to 2025 ⓘOperating margin then vs now, from reported annual statements. A falling margin after a boom year is the classic peak-earnings signal: the growth rate then leans on an inflated base.17% → 11%
⚠ Rate on operating basis: 2025 sits 91% above its own trend.

Growth Forecast

Little optimism in the price
The price assumes less growth than the company has delivered so far.
What the price assumes ⓘThis turns our valuation around: instead of asking what the share is worth, it asks what growth the current price requires. It uses the cash the company keeps after all spending (free cash flow), the same discount rate as our models, five years of growth, then slowing evenly to 2 % a year by year ten. Compared with the analysts' sales forecasts extended to the same five years (at least three analysts, for context only, it does not enter the Fair Value): within 3 percentage points counts as "in line" (amber), below that little optimism (green), above that a lot of optimism (red).
+28.1%
Yearly growth needed for the next five years to justify today's price.
What forecasts expect
n/a
No analyst forecast available.
After inflation (Argentina: IMF forecast 13.8% a year to 2030) that is about +12.6% a year for the price.

Watch CECO2, get fair value alerts →

Compare Enel Generacion Costanera SA with another stock

Price, fair value, quality and upside side by side.

Free, no sign-up

Peer GroupⓘHow this stock ranks against its industry: the green marker is this stock, the band is the typical 25–75% peer range, and the tick is the median.Utilities - Regulated Electric · 155 stocks

Beats the industry median on 12/13 measures
Overall it ranks above its industry peers.
Valuation
Quality Score 54 · Above median
Fair Value upside +10.0% · Above median
Profitability
Return on equity (12 months) 31.4% · Top 25%
Return on assets 3.2% · Below median
Net margin (12 months) 20.1% · Top 25%
Operating margin (12 months) 28.6% · Top 25%
Growth and dividend
Revenue growth (quarter YoY) 718.0% · Top 25%
Balance sheet
Debt / equity 0.25× · Lowest 25%

Valuation Multiplesvs Utilities - Regulated Electric median · lower = cheaper

P/E (12 months) 4.3× · Cheapest 25%
P/B 1.57× · Cheaper than median
P/S (12 months) 0.93× · Cheaper than median
Price / free cash flow (fiscal year) 13.4× · Cheaper than median
EV/EBITDA 2.5× · Cheapest 25%

Strength profile in five axes (Snowflake)

VALUEFUTUREPASTHEALTHDIVIDEND
This stock
VALUEFUTUREPASTHEALTHDIVIDEND
Sector peers
VALUE (fair-value potential)47 · sector 14
FUTURE (revenue growth)100 · sector 29
PAST (return on equity)100 · sector 40
HEALTH (low debt)88 · sector 52
DIVIDEND (yield)0 · sector 63

Context: sector, industry, market

Values & ESG

Does this company touch areas you may want to avoid? The classification is inferred from sector and industry.

None of the checked exposures detected

Similar stocks

10 more Utilities - Regulated Electric stocks, each showing price versus our Fair Value estimate.

Stock Price Fair Value vs Fair Value Compare
PG&E Corporation PCG $13.25 $17.29 +30% vs CECO2
Exelon Corporation EXC $46.25 $36.01 −22% vs CECO2
American Electric Power Company AEP $129.18 $100.03 −23% vs CECO2
Xcel Energy Inc XEL $81.61 $53.45 −35% vs CECO2
The Southern Company SO $93.59 $56.88 −39% vs CECO2
Duke Energy Corporation DUK $129.16 $75.79 −41% vs CECO2
Dominion Energy, Inc D $67.66 $38.26 −43% vs CECO2
Consolidated Edison, Inc ED $121.00 $61.74 −49% vs CECO2
NextEra Energy, Inc NEE $85.12 $29.83 −65% vs CECO2
Entergy Corporation ETR $111.15 $37.37 −66% vs CECO2

Explore undervalued stocks

More undervalued Utilities stocks →

Try a ready-made strategy

Pick a strategy and jump into the live analysis with that exact screen applied.

🥇 Backtested Best 🏆 Big Names 💎 Quality on Sale 🚀 Profitable Growth 🧊 Quality Compounders 💵 Dividend Stars 📈 Strong Momentum 📉 Fallen Angels ⚖️ Deeply Undervalued 🔍 Small-Cap Gems 🏰 Moat at a Fair Price 💼 Insider Buying 🎩 Buffett-Style Quality 📚 Peter Lynch GARP 🧮 Greenblatt Magic Formula 🛡️ Graham Defensive

Discover tools

For bloggers & editors: embed code + live data

For bloggers, editors and developers: paste this into your site or blog (a “Custom HTML” block in WordPress), it shows the current fair value and links back here. Free, plain HTML, and welcome. Full data streams (CSV/JSON) at /developers.
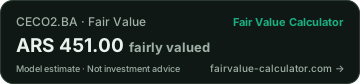
Enel Generacion Costanera SA: fair value per Fair Value Calculator

Cite: Fair Value Calculator (2026). "Enel Generacion Costanera SA Fair Value". https://www.fairvalue-calculator.com/stock/CECO2

Frequently asked questions

Is Enel Generacion Costanera SA (CECO2) overvalued or undervalued?
As of Nov 14, 2026, our model estimates a fair value of 451.00 ARS versus a price of 410.00 ARS, about +10% upside (fairly valued).
What is the fair value of CECO2?
Our model-based fair value for Enel Generacion Costanera SA is 451.00 ARS (as of Nov 14, 2026), built from audited fundamentals. The current price: 410.00 ARS.
What is the quality score of CECO2?
Enel Generacion Costanera SA has a Quality Score of 54/100. It measures business quality (profitability, growth, cash flow, balance-sheet strength, investment discipline, share issuance). Market factors such as price momentum and volatility do not enter the number; they are shown separately in the detail view.
What is the price target for Enel Generacion Costanera SA (CECO2)?
Our model-based price target is the fair value of 451.00 ARS (as of Nov 14, 2026) from 24 valuation models. Cautious scenario 280.82 ARS, optimistic scenario 622.97 ARS. It is a calculation from audited fundamentals, not an analyst target.
What is the Enel Generacion Costanera SA stock forecast for 2026?
Our models put fair value at 451.00 ARS, about +10% upside versus a price of 410.00 ARS (fairly valued). Cautious scenario 280.82 ARS, optimistic scenario 622.97 ARS. The calculation is refreshed regularly with new filings.
What is the revenue of Enel Generacion Costanera SA (CECO2)?
Enel Generacion Costanera SA reported trailing-twelve-month revenue of about 315B ARS (latest available figure, as of Nov 14, 2026).
What growth is priced into Enel Generacion Costanera SA (CECO2)?
For today's price to be fair in a discounted-cash-flow model, Enel Generacion Costanera SA would have to grow free cash flow by +28.1 % per year for five years (discount rate 22.2 %, then slowing evenly to 2 % perpetual growth by year ten). Over the last 5 years revenue grew +77.1 % per year. As of Nov 14, 2026.
What discount rate (WACC) does the fair value of CECO2 use?
Our models discount Enel Generacion Costanera SA at 22.2 %: a base by market capitalisation (micro), country premium for Argentina. The same rate applies in all 26 models.
What is a reverse DCF?
A reverse DCF turns the usual calculation around. Instead of deriving a value from assumptions, it takes today's price as given and asks: what free-cash-flow growth would a company have to deliver for exactly this price to be fair? The result is not a forecast but the expectation already priced in. For Enel Generacion Costanera SA that is +28.1 % per year for five years, then slowing evenly to 2 % by year ten, using the same discount rate (22.2 %) and the same formula as our fair value.
How much growth has Enel Generacion Costanera SA (CECO2) delivered so far?
Over the past 5 years revenue at Enel Generacion Costanera SA grew +77.1 % a year. The price currently implies free-cash-flow growth of +28.1 % per year. Comparing the two shows how much confidence is in the price: if it demands more than has been delivered, the business has to accelerate for the maths to work.
How fast is the sector of Enel Generacion Costanera SA (CECO2) growing?
The median revenue growth in the sector is +4.8 % a year. That is the yardstick for the growth priced into Enel Generacion Costanera SA (+28.1 % per year): it shows whether the expectation is within the usual range or beyond it.
What is the free cash flow yield of Enel Generacion Costanera SA (CECO2)?
The free-cash-flow yield on the price is 7.61 %: that much free cash flow Enel Generacion Costanera SA produces per unit of market value. When it exceeds the discount rate of our models (22.2 %), the business already earns more than its cost of capital demands, and the price needs little additional growth.
What is the intrinsic value of Enel Generacion Costanera SA (CECO2)?
Intrinsic value and fair value mean the same thing: what the business is worth on its numbers, independent of the share price. For Enel Generacion Costanera SA it is 451.00 ARS per share (as of Nov 14, 2026), against a price of 410.00 ARS. It is the blended result of 24 valuation models in 7 families (DCF Models, Earnings-Based, Multiples, Asset-Based, Growth DCF, Economic Profit, Growth Earnings).
Is Enel Generacion Costanera SA stock overvalued or undervalued in 2026?
As of Nov 14, 2026, CECO2 trades below its calculated fair value: price 410.00 ARS, fair value 451.00 ARS, a gap of about +10% (fairly valued). The calculation is refreshed with each new quarterly report, so the verdict can change during the year.
Is fair value the same as the market price of CECO2?
No. The price is what the market pays today (410.00 ARS); the fair value is what the company's own numbers justify (451.00 ARS). For Enel Generacion Costanera SA the two are 41.00 ARS per share apart. That gap is exactly why we show both numbers side by side.
How much is Enel Generacion Costanera SA worth?
The market values Enel Generacion Costanera SA at about 294B ARS (market capitalisation, as of Nov 14, 2026). Per share that is 410.00 ARS; our models calculate a fair value of 451.00 ARS per share.
What do the bullish and bearish scenarios say about CECO2?
Our models span a range for Enel Generacion Costanera SA: cautious scenario 280.82 ARS, base 451.00 ARS, optimistic 622.97 ARS per share (as of Nov 14, 2026, price 410.00 ARS). The range comes from different growth and margin assumptions, not from analyst opinions.
What is the P/E ratio of CECO2?
Enel Generacion Costanera SA trades at a price-to-earnings ratio of 4.3 (as of Nov 14, 2026). A P/E on its own says little: it compares the price with ONE year of profit, while our fair value of 451.00 ARS is built from several models across several years. Median P/E at fiscal year-end, 7 fiscal years (2017 to 2025), reported earnings: 20.5. Other multiples: P/B 1.6, P/S 0.9, EV/EBITDA 2.5.
How solid is the balance sheet of Enel Generacion Costanera SA (CECO2)?
Balance-sheet figures for Enel Generacion Costanera SA (as of Nov 14, 2026): return on equity 31.4%, debt of 0.25 per unit of equity. They feed the Quality Score of 54/100, which measures business quality independently of the share price.
How far is CECO2 from its 52-week high?
Enel Generacion Costanera SA trades at 410.00 ARS, about 27% below its 52-week high of 560.00 ARS and 17% above the low of 349.50 ARS (as of Nov 13, 2026). Distance from the high says nothing about value: that is what the fair value of 451.00 ARS is for.
Which stocks are comparable to Enel Generacion Costanera SA?
From the same area (Utilities) we also value NextEra Energy, Inc, The Southern Company, Duke Energy Corporation, American Electric Power Company, among others. Each of them has its own fair-value calculation on this site using the same models, so the comparison is like for like.
Is Enel Generacion Costanera SA stock attractive at the current price?
The data as of Nov 14, 2026: price 410.00 ARS, calculated fair value 451.00 ARS (+10%), Quality Score 54/100, from 24 models. Whether that fits your horizon and risk tolerance is your call. We provide the calculation, not investment advice.
How is the fair value of CECO2 calculated?
We run Enel Generacion Costanera SA through 24 models from 7 families: DCF Models, Earnings-Based, Multiples, Asset-Based, Growth DCF, Economic Profit, Growth Earnings. Every model gets the same audited fundamentals; the fair value of 451.00 ARS builds on their evidence-weighted average, with the spread shown as a cautious and an optimistic scenario.
Is it still worth investing in stocks now?
The global stock market currently sits 13.9% above its aggregate fair value. Enel Generacion Costanera SA currently trades 9% below its own fair value, and the market average says nothing about that. An expensive market is no reason to stay out and no reason to buy everything at once: keep a broad savings plan running, buy single stocks only with money you can do without, and hold part of your money liquid while the market is high. The full picture including sectors is on is it worth investing now.
What is the share price of Enel Generacion Costanera SA (CECO2)?
The closing price on Nov 13, 2026 was 410.00 ARS. Our model-based fair value is 451.00 ARS, about +10% upside (fairly valued). We carry closing prices from our data provider, not a live tick.
What should I pay attention to with Enel Generacion Costanera SA right now?
The price sits close to our fair value, market and models broadly agree here, little valuation tension. A fairly wide model range (280.82 ARS to 622.97 ARS) leaves room in how you read the outcome. Evidence is limited here (fewer models, shorter history), so the fair value is a rougher estimate than usual.

Key figures of Enel Generacion Costanera SA

How large is the market capitalisation of Enel Generacion Costanera SA (CECO2)?
The market capitalisation of Enel Generacion Costanera SA is 294B ARS (≈ $191M). The stock-market value of the whole company: share price times number of shares. It is what the market asks for the entire business today.
What is the P/S ratio of Enel Generacion Costanera SA (CECO2)?
The price-to-sales ratio of Enel Generacion Costanera SA is 0.93 (last twelve months). Price to sales: market value relative to yearly revenue. Useful when profit is thin or distorted.
What are the earnings per share of Enel Generacion Costanera SA (CECO2)?
Earnings per share at Enel Generacion Costanera SA are 95.26 ARS (price ÷ EPS = P/E 4.3). Earnings per share over the last twelve months: total profit spread across every single share.
What is the net margin of Enel Generacion Costanera SA (CECO2)?
The net margin of Enel Generacion Costanera SA is 20.1% (last twelve months). How much of every unit of revenue ends up as profit. 10% means 10 cents of profit per dollar of sales.
What is the return on equity of Enel Generacion Costanera SA (CECO2)?
The return on equity (ROE) of Enel Generacion Costanera SA is 31.4% (last twelve months). Profit relative to shareholders' equity, how efficiently the company works with its owners' money.
What is the EBIT return on assets of Enel Generacion Costanera SA (CECO2)?
On an EBIT basis the return on assets of Enel Generacion Costanera SA is −1.3% (avg 5y). Operating profit (EBIT) relative to everything the company owns, as a multi-year average. It describes the business model rather than one good or bad year.
What is the operating margin of Enel Generacion Costanera SA (CECO2)?
The operating margin of Enel Generacion Costanera SA is 28.6% (last twelve months). Profit from the core business (before interest and taxes) relative to revenue.
How fast is revenue growing at Enel Generacion Costanera SA (CECO2)?
Revenue at Enel Generacion Costanera SA is growing +718% versus a year earlier (3y avg +114%). How much revenue grew versus a year earlier (YoY). The 3-year average next to it puts the single year in context.
How fast are earnings growing at Enel Generacion Costanera SA (CECO2)?
Earnings per share at Enel Generacion Costanera SA are growing +78.1% versus a year earlier. How much earnings per share grew versus a year earlier.
How much net debt does Enel Generacion Costanera SA (CECO2) carry?
The net debt of Enel Generacion Costanera SA is 49.7B ARS (fiscal year 2025, ≈ 2.3 yrs of FCF). Debt minus cash on hand. The note shows how many years of free cash flow could in theory pay it off.
Free · no account needed

Watch Enel Generacion Costanera SA in the live analysis

One click puts Enel Generacion Costanera SA on your watchlist: fair value and trend at a glance, plus comparison, the diversification check and the 27,000+ stock screener.

Watch for free →

Zero risk: nothing is ever charged. Your watchlist is yours, with or without an account.