

Reco International Group (RGI) fair value: what the stock is really worth
As of Nov 5, 2026: fair value (intrinsic value) of Reco International Group stock C$0.01, price C$0.01, upside +5.0%, quality 39 out of 100. Rating: fairly valued. Calculated from audited financials with 3 of our 26 valuation models and 37 quality factors, updated daily.
- Keep an eye on it?Free in your watchlist: 5 stocks without an account, 10 with one Yes, for free
 Thin data
Nov 14, 2026
Reco International Group
RGI · VThe stock is already about fairly priced, weak company and falling price: meets none of the 3 rules.
What runs behind every stock
69 individual criteria per stock, every one traceable See the method →
Price vs Fair Value
White line = price, green steps = our fair value per fiscal year. As of Nov 14, 2026.
How to read this chart
60‑month range C$0.0050 – C$0.0650 · the C$0.0050 price screens below the C$0.0053 fair value. As of Nov 14, 2026.
Every Wednesday you see whether Reco International is on track or worth a review, plus price against fair value. Free, up to 3 stocks.
We send you a confirmation link. Unsubscribe with one click.
Company profile
Reco International Group Inc., together with its subsidiaries, engages in the commercial and residential construction, and millwork operating businesses in British Columbia, Canada.
Show moreShow less
The company's services include project management, pre-design and build, interior design and build, tenant improvements, general contracting, construction set of drawings, site measurement, CAD drawings, space planning, 3D renderings, furniture layout and specifications, millwork design, procurement, and finishing work and upholstery.
Its services are used in retail and supermarket projects, as well as commercial and institutional sectors, such as food services, schools, hospitals, and government services. Reco International Group Inc. was incorporated in 1999 and is headquartered in Richmond, Canada.
Stock analysis
Reco International Group (RGI) currently trades at C$0.0050, while our model-based Fair Value estimate is C$0.0053, so the stock looks roughly fairly valued today (gap 4.8%).
Show more
Valuation
How firm this estimate is: it rests on 3 models at a data quality of 95/100, which puts the data coverage at low.
Quality & growth
The Quality Score stands at 39/100 (below-average quality), in the Industrials sector.
Weak Growth: Revenue growth is inconsistent: the periods point in different directions, so there is no trend to rely on.
Reco International Group reported revenue of C$2.8M in FY2025 versus C$1.5M in FY2021, a compound +16.3%/yr. Reported net income was −C$1.4M in FY2025.
Key figures
Market cap C$248K (≈ $174K) Micro · P/S ratio 0.11 · EPS (TTM) C$−0.0100 · Net margin −50.8% · Return on assets (EBIT) −66.8% (5-year average) · Operating margin −30.3% · Revenue (TTM) C$2.4M · Revenue growth (YoY) −45.6%.
Competitive moat
Our AI-assisted moat analysis scores the competitive advantage at 8 out of 100 (low confidence).
What moves the price
The share trades about 67% below its 52-week high and at its 52-week low, currently below its 200-day average.
For context, the median of 10 Industrials peers we cover trades at −31% fair-value upside, at 5%, RGI screens cheaper than that median.
Fair Value models
All 3 models by family
Quality Score breakdown
It rates the business: profits, how they develop, real cash, balance sheet, investing and share count.
Revenue & earnings trend
Growth Forecast
Watch RGI, get fair value alerts →
Compare Reco International Group with another stock
Price, fair value, quality and upside side by side.
Peer GroupⓘHow this stock ranks against its industry: the green marker is this stock, the band is the typical 25–75% peer range, and the tick is the median.Engineering & Construction · 826 stocks
Valuation Multiplesvs Engineering & Construction median · lower = cheaper
Strength profile in five axes (Snowflake)
PAST 0: with negative equity (buybacks among others) return on equity is not meaningfully computable.
Context: sector, industry, market
- Is the Industrials sector expensive or cheap?
- P/E, EV/EBITDA and margins by industry (reference tables)
- Debt-to-equity by industry
- Price/FCF by industry
- Piotroski F-Score screener with fair value
- Undervalued stocks: Industrials
- Undervalued stocks: Canadian Stocks
- Valuation of the Canada market
Values & ESG
Does this company touch areas you may want to avoid? The classification is inferred from sector and industry.
Similar stocks
10 more Engineering & Construction stocks, each showing price versus our Fair Value estimate.
| Stock | Price | Fair Value | vs Fair Value | Compare |
|---|---|---|---|---|
| Vinci SA DG | €115.50 | €186.68 | +62% | vs RGI |
| Bouygues SA EN | €44.30 | €65.77 | +48% | vs RGI |
| Comfort Systems USA, Inc FIX | $1,113 | $1,122 | +1% | vs RGI |
| EMCOR Group EME | $659.36 | $524.14 | −21% | vs RGI |
| ACS, Actividades de Construcción y Servicios, S.A ACS | €91.05 | €62.38 | −31% | vs RGI |
| Samsung C&T Corporation 028260 | 285,000 KRW | 159,702 KRW | −44% | vs RGI |
| Larsen & Toubro Limited LT | ₹4,144 | ₹2,302 | −44% | vs RGI |
| HOCHTIEF Aktiengesellschaft HOT | €374.40 | €203.86 | −46% | vs RGI |
| APi Group APG | $43.47 | $19.20 | −56% | vs RGI |
| Quanta Services, Inc PWR | $602.01 | $162.41 | −73% | vs RGI |
Explore undervalued stocks
More undervalued Industrials stocks →
Try a ready-made strategy
Pick a strategy and jump into the live analysis with that exact screen applied.
Discover tools
For bloggers & editors: embed code + live data
For bloggers, editors and developers: paste this into your site or blog (a “Custom HTML” block in WordPress), it shows the current fair value and links back here. Free, plain HTML, and welcome. Full data streams (CSV/JSON) at /developers.
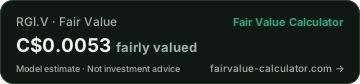
Cite: Fair Value Calculator (2026). "Reco International Group Fair Value". https://www.fairvalue-calculator.com/stock/RGI
Frequently asked questions
Is Reco International Group (RGI) overvalued or undervalued?
What is the fair value of RGI?
What is the quality score of RGI?
What is the price target for Reco International Group (RGI)?
What is the Reco International Group stock forecast for 2026?
What is the revenue of Reco International Group (RGI)?
What growth is priced into Reco International Group (RGI)?
What discount rate (WACC) does the fair value of RGI use?
What is a reverse DCF?
How much growth has Reco International Group (RGI) delivered so far?
How fast is the sector of Reco International Group (RGI) growing?
What is the free cash flow yield of Reco International Group (RGI)?
What is the intrinsic value of Reco International Group (RGI)?
Is Reco International Group stock overvalued or undervalued in 2026?
Is fair value the same as the market price of RGI?
How much is Reco International Group worth?
How solid is the balance sheet of Reco International Group (RGI)?
How far is RGI from its 52-week high?
Which stocks are comparable to Reco International Group?
Is Reco International Group stock attractive at the current price?
How is the fair value of RGI calculated?
Is it still worth investing in stocks now?
What is the share price of Reco International Group (RGI)?
What should I pay attention to with Reco International Group right now?
Key figures of Reco International Group
How large is the market capitalisation of Reco International Group (RGI)?
What is the P/S ratio of Reco International Group (RGI)?
What are the earnings per share of Reco International Group (RGI)?
What is the net margin of Reco International Group (RGI)?
What is the EBIT return on assets of Reco International Group (RGI)?
What is the operating margin of Reco International Group (RGI)?
How fast is revenue growing at Reco International Group (RGI)?
How fast are earnings growing at Reco International Group (RGI)?
Watch Reco International Group in the live analysis
One click puts Reco International Group on your watchlist: fair value and trend at a glance, plus comparison, the diversification check and the 27,000+ stock screener.
Watch for free →Zero risk: nothing is ever charged. Your watchlist is yours, with or without an account.