PEG Calculator
Price Earnings Growth (PEG) Ratio Calculator and Formula.
Insert Price/ Earnings Ratio (P/E) and Earnings Growth into this PEG Calculator to calculate PEG (Price Earnings Growth). The P/E and the Earnings Growth can be found via a Google search, in the annual report on the company’s homepage under “Investor Relations” or on relevant stock portals.
A large number of different evaluation models are used in our Premium Tools and the required data is loaded automatically. Find the PEG for more than 45,000 stocks worldwide!
Price/Earnings to Growth or PEG as it is known is a relative valuation metric which builds upon the existing P/E ratio by incorporating earnings growth into it in order to eliminate some of the shortcomings of the standard P/E ratio while evaluating high growth companies. Unlike other relative valuation metrics, PEG is generally unique in that it can be used to compare companies across industries and sectors alongside companies in its own unique sector.
In essence, PEG gives you a more accurate picture of undervaluation or overvaluation of the company after taking growth into account. This is an important metric to know to enable you to focus on the high growth sectors which otherwise would be eliminated by filters set in other standard ratio and it will be clear as to why when we move forward. Knowledge is easily processed when accompanied by an example so let us look at one while we try to understand this ratio in detail. Before you use the PEG Calculator be sure to check the P/E Calculator.
The Price/Earnings to Growth (PEG) ratio builds upon the classic P/E ratio by factoring in the company’s earnings growth rate. While the P/E ratio alone can sometimes mislead investors—particularly when analyzing fast-growing companies—the PEG ratio helps put valuation into perspective by answering a critical question: Is the company’s growth worth the price investors are paying?
A PEG ratio close to 1 is often considered “fair value,” meaning that the price investors pay is in line with the company’s expected earnings growth. A ratio below 1 suggests potential undervaluation, as the company’s growth may justify a higher price. Conversely, a PEG above 1 can indicate overvaluation—though in some cases, such as rapidly expanding tech or biotech firms, investors may be willing to pay a premium for future growth.
What makes the PEG ratio especially powerful is its versatility: it allows comparisons not only within the same industry but also across different sectors. For example, two companies with identical P/E ratios can have very different PEG ratios if one is growing earnings much faster than the other. By integrating growth into the equation, the PEG ratio provides a more dynamic and forward-looking measure of value than the traditional P/E.
Two Practical Tips for Investors:
Look at long-term growth, not just short-term projections: A company may appear cheap on PEG if it reports temporary earnings spikes. Always verify whether the expected growth rate is sustainable over several years.
Combine PEG with quality metrics: A low PEG ratio is attractive, but it only pays off if the company has a solid balance sheet, strong cash flows, and competitive advantages. Use PEG as part of a broader analysis rather than as a standalone decision-maker.
 Ratio Calculator 1")
Top 10 Stocks: High Growth Strategy
 Ratio Calculator 2")
- Nutrien Ltd. (0NHS)
- Netflix Inc. (0QYI)
- Lam Research Corp. (0JT5)
- Occidental Petroleum Corp. (0KAK)
- Trip.com Group Ltd. ADR (0I50)
- Lennar Corp. Cl A (0JU0)
- Marathon Oil Corp. (0JY9)
- Taiwan Semiconductor Manufacturing Company Limited (TSM)
- Huatai Securities Co. Ltd. GDR (HTSC)
- Meta Platforms Inc. (META)
This list is updated daily by our Stock Screener Tool, covering more than 60,000 stocks worldwide. Discover this and many other Top-Lists inside the Fairvalue Calculator Premium Tool – try it now for free!
PEG Formula:
Formula PEG Calculator:
PEG = Price to Earnings Ratio / EPS Growth
(You can first use the P/E Ratio Calculator and then this PEG Calculator.)
All values are available in financial statements of companies expect EPS growth which needs to be calculated from historical EPS. Ideally this ratio demands future expected growth values to determine true nature of valuation as historical valuations can lead to some errors. The biggest issue with P/E ratio is that it tends to overvalue high growth companies. Visit our P/E calculator for an example of the same. When screening stocks for say low P/E it is extremely likely that a good high performing high growth and truly undervalued stock will be filtered out due to it having a high P/E.
PEG aims to eliminate this by incorporating each company’s growth into the standard P/E ratio. By incorporating growth, the new ratio that is formed gives a clearer picture whether the company is being valued in line with its growth or its valuations are exceeding or falling short of its growth rate.
Example PEG Calculator:
As mentioned in the start, the PEG Calculator can be sector agnostic. To showcase this special feature of sectorial independence, we shall look at some popular companies across sectors: Disney, Johnson & Johnson, JPMorgan & Chase and Procter & Gamble. We shall look at the PEG of these companies and compare them with their performance over last year. As with other ratios, PEG is independent of currency as both P/E ratio and EPS Growth are in number terms only without dependence on currency.
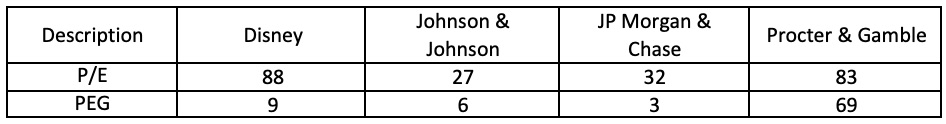

Procter & Gamble as expected has performed poorly last year in the face of a raging bull market. Surprisingly Johnson & Johnson which has the lowest P/E of all has also not done well. JP Morgan & Chase with a high P/E but low PEG has done phenomenal as we can see but so has Disney with a very high P/E and PEG. The reason for this splendid performance in the face of high valuations is the growth factor and therein lies the drawback of PEG.
What you should be looking for:
In an ideal scenario, you want PEG to be less than 1 to highlight undervaluation and more than 1 to highlight overvaluation. Check the PEG Calculator and its PEG to be lower than 1! The reason being if P/E is less than growth, it means the company is not being given the right valuation and is being undervalued basis the growth it can expect. Once the growth materializes the P/E will have to be rerated to move in line with growth thus signifying undervaluation which will happen via share price appreciation.
In a similar vein, a PEG > 1 means that the company is being given more valuation than it deserves basis the growth it has. As the poor growth materializes, the P/E will be rerated to reflect that growth and thus share prices will depreciate.
However that is an ideal scenario and markets are not ideal. The most crucial input in PEG is the growth rate. P/E is very easy to calculate and is widely available. Expected growth rates are not. Historical growth rates are not what drive the markets. Market is always forward looking and an expected growth rate will give you a clearer idea of undervaluation or overvaluation than historical growth rates since the historical growth rates have already come to fruition.
Estimates of growth rate vary from individual to individual. Generally broker analysts often come out with their estimated growth rates across the next 3 to 5 years. An average of all broker estimates gives you a growth rate that can be used to calculate PEG. If the company beats that growth rate, the stock will jump in price as its PEG will indicate undervaluation and vice versa.
In case of Disney, the growth rate has been phenomenal with its launch of Disney+ streaming services which has gained a lot of market share and can now rival Netflix as well. PEG has trouble with large stable dividend paying companies in a similar way to what P/E has with high growth companies.
Large dividend paying companies generally don’t tend to be high growth companies as they are using the spare cash to pay dividend instead of deploying it in growing the company and also because the opportunities to grow are not that prevalent for them.
In such a case, PEG will tend to be high for them which will eliminate them from screens of investors who can do with stable dividend paying companies in their portfolio.
Low P/E companies experiencing business operation problems can have a sudden jump in earnings due to selling off assets. This earnings growth will then reduce PEG significantly thus undervaluing the company incorrectly and this makes the most important case for not relying on historical growth rates.
While one should be looking for a low PEG ratio when using the PEG Calculator, growth remains the paramount factor to be kept in mind. It is often difficult to estimate growth numbers directly without knowing the business. Numbers often become easier to estimate if there is a growth story behind it.
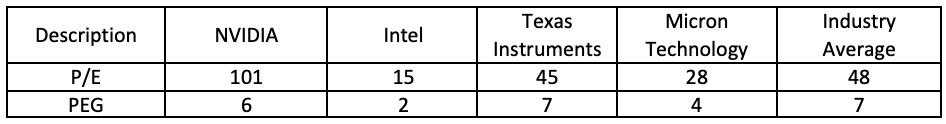
For e.g. if I were to tell you to estimate Apple’s earnings growth for next year, you would be unable to but if I were to tell you that Apple is going to launch a new iPhone next year and it will be priced at least 15% higher than the last one, you can now estimate that if margins are kept intact, one can expect a 15% growth in revenue not taking into account new buyers of the phone. To demonstrate this phenomenon let us look at the industry that has really benefited from the recent crypto boom: Semiconductors.

Surprising isn’t it? The reason behind this requires us to take a dive into the story behind this growth or lack of it. Crypto enthusiasts may know this but for those new to the scene, cryptocurrencies are created via process called mining which is basically lending your computing power for blockchain calculations which on successful creation of a block (i.e. completion of calculations) generates a piece of code as a reward which is cryptocurrency.
Mining for Bitcoin and other advanced coins requires high levels of computing power, beyond the capabilities of current CPUs. However GPUs or Graphical Processing Units (Simply Graphics Cards) are very powerful and the growth in their computing power has been phenomenal. NVIDIA is the market leader in graphics cards and the demand for its graphics cards have been very high, in fact high is an understatement.
NVIDIA graphics cards have been found selling for a markup of at least 2-3 times. No wonder all growth estimates of NVIDIA 1 year ago were lower and the stock undervalued.
Intel on the other hand despite having low P/E and PEG has not seen any growth in demand for its computer chips thus the poor performance. So while you are looking for a low PEG ratio, take a look at the potential growth story behind it in order to get a good enough estimate to value the company accurately. At the end, PEG like all valuations will have some error but unlike other valuations, if your story is strong, strong returns is but a matter of waiting irrespective of the accuracy of the growth numbers.
Conclusion
The PEG Calculator is a pretty nifty tool to determine valuation in high growth companies but as its strength suggests it must be applied to high growth companies only. Application of PEG to low growth companies will lead to distorted results. However, a single ratio is not enough to make an investment decision.
One must look at other metrics like Price to Book value and Price to earnings along many others to arrive at a consensus of valuation. We have over 12 such key financial ratio calculators on our website, all available for free. Calculate the key ratios and build a consensus through them to determine whether a company is truly undervalued or overvalued. Alternatively, join our Premium Tools and we will do all of this work for you, providing you various fair values right on your very own premium dashboard.
In my experience, the PEG Calculator is a good tool to look at when exploring high growth sectors like technology, semiconductors etc. while they are useless when looking at defensive sectors like Utilities or large dividend companies, for e.g. Coca Cola. The crux however remains in estimating growth rates and the best way is to first identify a story, see if it has precedence and then take an average of all analyst numbers to arrive at projected growth rates.
Company management calls which happen during results and whose transcripts are available are also good places to source growth estimates. Usually managers will offer some predictions of growth in these calls and one must discount them by at least 20-30% to arrive at the actual expected growth. However their numbers will be closer to the real numbers as possible and simply calculate PEG, compare with others and make an appropriate investment decision in consensus with other ratios and valuation metrics.
FAQ: PEG (Price/Earnings-to-Growth) Calculator
Relate a stock’s P/E to its expected EPS growth to see whether the price looks rich or reasonable for the growth on offer.
What is the PEG ratio?▾
How is PEG calculated here?▾
PEG = (Price ÷ EPS) ÷ Growth.Enter growth as a percent (e.g., 12 for 12%) and we convert it to a decimal in the formula.
Should I use TTM or forward numbers?▾
- Forward PEG (common): forward P/E with next-3–5y expected EPS growth.
- TTM PEG: TTM P/E with a conservative growth view.
- Be consistent across peers and note the source of growth assumptions.
How do I read the PEG result?▾
- ~1.0: price roughly matches growth (rule of thumb).
- < 1.0: cheaper for the growth—could be attractive.
- > 1.5–2.0: rich—needs strong quality and durability.
When is PEG not meaningful?▾
- Negative or tiny EPS (P/E unstable).
- Cyclicals with swingy earnings—use normalized EPS.
- Highly dilutive situations—check share count trends.
What about PEGY and quality checks?▾
growth + dividend yield). Always cross-check quality using
Piotroski F-Score and balance-sheet risk with the
Altman Z-Score.
How does this relate to Peter Lynch’s approach?▾
Common mistakes to avoid▾
- Entering growth as a decimal (use percent: 12 for 12%).
- Mixing TTM P/E with forward growth inconsistently.
- Using short-term spikes in EPS as “growth”. Prefer multi-year CAGR.
What’s a simple workflow with this page?▾
- Get candidates in the Stock Screener.
- Enter P/E and growth here → review PEG.
- Cross-check valuation on Stock Valuation; if promising, build a DCF for cash-flow proof.
Is this investment advice?▾
45.000+ Stocks with PEG Ratio Analysis.
100% Satisfaction - 0% Risk - Cancel Anytime.