Market Valuation
Unique Tools for Stock Market Valuation.

Before investing in stocks, it is essential to analyze the overall market! The stock market does not move in a straight line but rather in waves. Excessive hope, greed, or fear can lead to temporary over- or undervaluations.
During periods of overvaluation, it is advisable to hold back cash, whereas, during favorable market conditions, one should consider aggressive investing and reducing the cash position in the portfolio.
The market valuation tools in our Premium Tools assist in identifying the status of the overall stock market and determining the appropriate cash allocation.
Stock Market Valuation within the Premium Tools
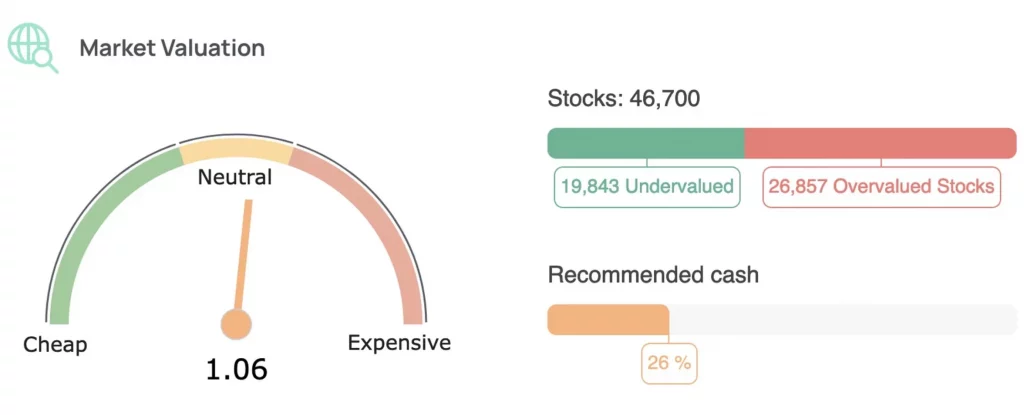
In the Market Analysis Tool, you can evaluate the overall stock market to determine whether it is currently undervalued or overvalued. Given that individual stocks are strongly influenced by the overall market, this tool is indispensable before making any investment in stocks. Rarely do individual stocks deviate significantly from the broader market trends.
Within the Market Analysis Tool, the Fair Value of the market is calculated by considering the average Price-to-Earnings (P/E) ratio, Price-to-Book (P/B) ratio, Price-to-Sales (P/S) ratio, and dividend yield of all stocks in the database. These average metrics are then compared to their long-term averages to derive a ratio indicating the deviation of current metrics from their historical averages.
Furthermore, the tool provides a comparison between overvalued and undervalued stocks in the database. The determination of whether a stock is overvalued or undervalued is based on an algorithm that analyzes numerous financial metrics, both qualitatively and quantitatively. The algorithm is supported by up to 12 different valuation models, which can be accessed individually for each stock in the stock analysis section.
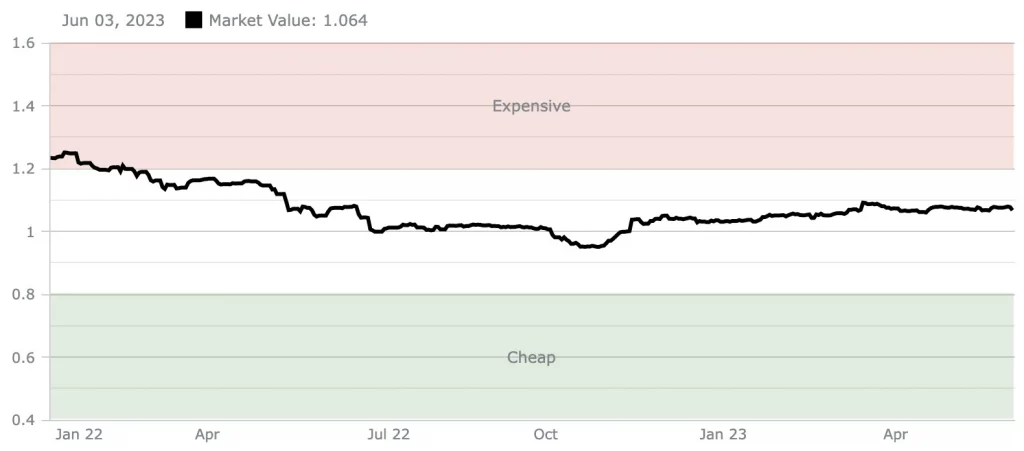
If there are more overvalued stocks than undervalued stocks currently identified in the tool, it is an additional indication that the market is in an expensive phase, and it is advisable to accumulate more cash. The average of all these factors yields the Market Fair Value, which is automatically recalculated on a daily basis. A value below 0.8 is considered extremely favorable, a value between 0.8 and 1.2 is neutral, and a value above 1.2 is expensive.
Therefore, it is preferred to allocate new funds to the stock portfolio only when the Market Analysis Tool indicates a value below 0.8. This approach requires patience as historically, such a low value is only observed during very weak market phases. It can take years for the market to reach such a low value, potentially missing out on returns during exceptionally strong market phases.
An alternative approach would be to rotate into riskier cyclical stocks when the market is particularly favorable, and exercise caution and focus on more resilient stocks when the market becomes more expensive. In practice, it is recommended to follow the currently suggested cash allocation, which can vary depending on the relative market price.
Crashes Often Present Buying Opportunities!
The following overview of past “stock market crashes” highlights how frequently stock market crashes occur and how quickly the stock market recovers from them. During relatively favorable periods of fear and downward exaggeration, there are often attractive buying opportunities! These are the phases that become clearly recognizable in market analysis tools.
The recent crash in 2020, caused by the coronavirus pandemic, resulted in a drawdown of -39% in the stock markets, and it took just under a year for the markets to reach their previous all-time highs. During this time, the overall market was in a favorable range. In summary, it can be said that approximately every 5 years, an event shakes the markets by almost 40%. Following such panics, the markets can quickly recover and reach new highs. Solid stocks can be acquired at significantly lower prices during such crashes when panic prevails in the stock market.
During these times, the market valuation in the tools shows an extremely favorable outlook, and these are the times when one wants to set aside money to secure stocks during the sell-off. The more expensive the market, the more cash one should accumulate, as an overheated market increases the likelihood of a crash. “Buy when the cannons are firing, and sell when the trumpets are blowing.” – Nathan Mayer Rothschild


In these charts, you can assess the market valuation and observe its historical performance. When the value is in the green zone, it indicates that the overall market is considered cheap, providing a favorable environment for investing in stocks. The first chart illustrates the period from January 2022 to April 2023, while the second chart covers January 2022 to December 2024. During this time, the overall stock market became more expensive, suggesting a recommended strategy of gradually reducing certain stock positions and increasing the cash allocation to up to 40%. This approach prepares for a potential market correction, where stocks may return to their intrinsic value and fair price levels. In the premium area, your personalized dashboard within the premium tools provides daily updates on market valuation rates and tailored cash allocation recommendations. These insights help you adjust your portfolio dynamically to align with market conditions and maintain an optimal balance between investments and cash reserves.
On the other hand, when the value is in the red zone, it is advisable to increase your cash holdings and invest only in safer assets.
Compare Indices to their Fair Value:
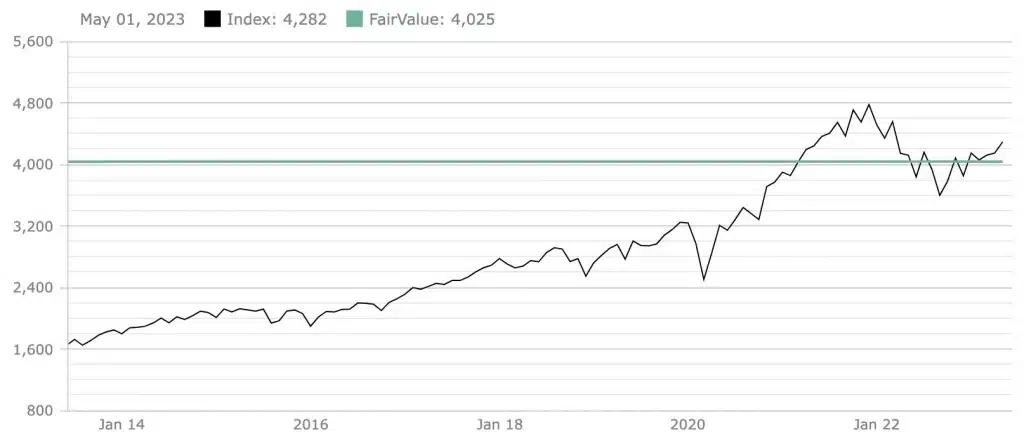
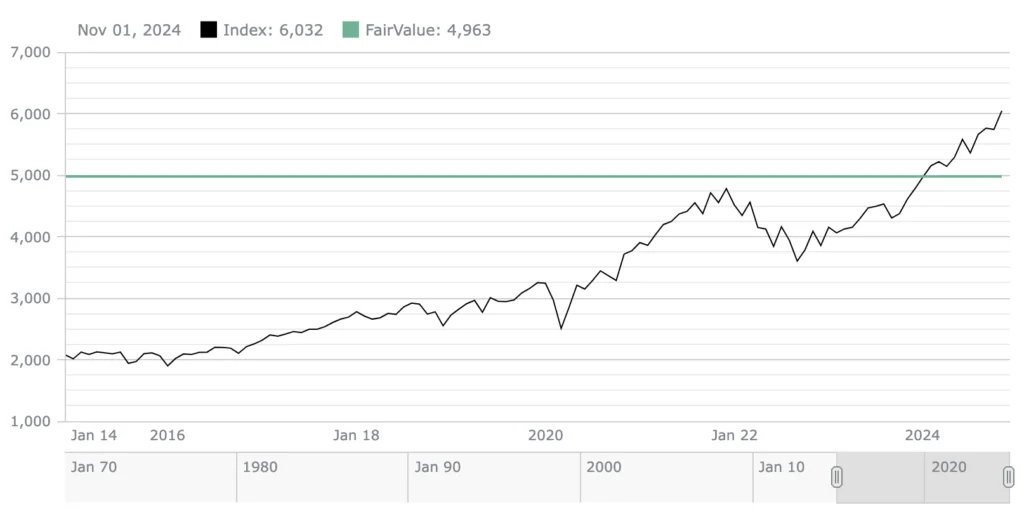
Another useful tool in market valuation is the comparison of current market valuation with relevant stock indices such as the S&P 500, Nasdaq 100, Dow Jones 30, Dax 40, and Eurostoxx 50, along with their daily fair values and price targets:

These two charts illustrate the development of the Index Fair Value analysis since 2014. The first chart shows the status as of spring 2023, while the second chart reflects the status at the end of 2024. As observed, the Fair Value of the S&P 500 has increased due to the improved performance of the companies within the index. However, relative to the rise in stock prices, the index has climbed disproportionately, leading to an overvalued market situation despite the positive business performance. This results in stocks within the index being relatively expensive. Sooner or later, the price will align with the Fair Value line.

- S&P 500: The S&P 500 is an equity index that reflects the performance of the 500 largest publicly traded companies in the United States.
- Nasdaq 100: The Nasdaq 100 is an equity index that tracks the performance of the 100 largest non-financial companies listed on the Nasdaq stock exchange.
- Dow Jones 30: The Dow Jones Industrial Average (short: Dow Jones) is an equity index that represents the performance of 30 major companies in the United States and is considered an indicator of the overall US stock market.
- DAX 40: The DAX (Deutscher Aktienindex) is the most important German stock index, consisting of the 40 largest publicly traded companies in Germany based on market capitalization and trading volume.
- Euro Stoxx 50: The Euro Stoxx 50 is a European blue-chip stock index that reflects the performance of the 50 largest companies in the Eurozone. It is a significant indicator of the European stock market’s development.
Buy Premium Tools Now!
100% Satisfaction. 0% Risk. Always cancellable.
