

Cognex Corporation (CGNX) fair value: what the stock is really worth
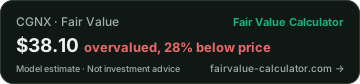
As of Nov 4, 2026: fair value (intrinsic value) of Cognex Corporation stock $38.10, price $53.06, that is 28.2% below the price, quality 77 out of 100. Rating: overvalued. Calculated from audited financials with 26 valuation models and 37 quality factors, updated daily.
- Keep an eye on it?Free in your watchlist: 5 stocks without an account, 10 with one Yes, for free
 Broad data
Nov 4, 2026
Cognex Corporation
CGNX · USOur calculation puts a fair price 28% below what the stock costs today.
Risks from the AI analysis
What runs behind every stock
69 individual criteria per stock, every one traceable See the method →
Price vs Fair Value
White line = price, green steps = our fair value per fiscal year. As of Nov 4, 2026.
How to read this chart
60‑month range $23.05 – $88.90 · fair‑value band $28.58 – $47.62 · the $53.06 price screens above the $38.10 fair value. Green steps = our fair value per fiscal year (point-in-time, no hindsight). 1 fiscal year is left out: there the valuation rested on only a fraction of the usual models. As of Nov 4, 2026.
Every Wednesday you see whether Cognex is on track or worth a review, plus price against fair value. Free, up to 3 stocks.
We send you a confirmation link. Unsubscribe with one click.
Company profile
Cognex Corporation provides machine vision products that capture and analyze visual information to automate manufacturing and distribution tasks in the United States, Europe, Greater China, and internationally.
Show moreShow less
Its machine vision products are used to automate the manufacture and distribution of discrete items, such as mobile phones, automotive components, and e-commerce packages, by locating, identifying, inspecting, and measuring them.
The company offers VisionPro software, a suite of patented vision tools for traditional rule-based tools and deep learning-enabled tools for advanced programming; vision systems that combine smart cameras and software to perform a wide range of tasks, including part location, identification, measurement, assembly verification, and robotic guidance; OneVision, a cloud-based platform designed to transform how manufacturers build, train, and scale AI-powered vision applications; In-Sight product line of vision systems and sensors; QuickBuild, which allows customers to build vision applications with a graphical and flowchart-based programming interface; DataMan, an image-based barcode reader for fixed-mount and handheld models, as well as barcode verifiers; and vision accessories, such as industrial cameras, lenses, lighting, vision controllers, frame grabbers, and I/O cards.
It sells its products to the automotive, logistics, packaging, consumer electronics, medical-related, semiconductor, and consumer products industries. The company was incorporated in 1981 and is headquartered in Natick, Massachusetts.
Stock analysis
Cognex Corporation (CGNX) currently trades at $53.06, while our model-based Fair Value estimate is $38.10, 28% below the price, so the stock looks overvalued today.
Show more
Valuation
Bull case: the DCF Models group reads highest at a median of $22.82 per share, and 0 of the 26 models we run sit above the $53.06 price.
Bear case: the Dividend Discount group reads lowest at $4.19, and 26 of the 26 models stay below the price. Data coverage for this calculation is high.
Scenario range: $28.58 (bear) to $47.62 (bull), the price of $53.06 sits above it. Bear and bull are the same models on cautious and optimistic assumptions, a range, not a price target.
Quality & growth
The Quality Score stands at 77/100 (high quality), in the Technology sector.
Mixed Growth: Revenue is growing, but margins or cash flow do not fully confirm the trend.
Cognex Corporation reported revenue of $994M in FY2025 versus $1.0B in FY2021, a compound −1.0%/yr. Reported net income was $114M in FY2025, compounding −20.0%/yr from FY2021.
Key figures
Market cap $9.8B Mid · P/E ratio 51.0 · P/S ratio 8.97 · EPS (TTM) $1.04 · Dividend yield 0.6% · Net margin 16.1% · Return on equity 11.2% · Return on assets (EBIT) 9.7%.
Competitive moat
Our AI-assisted moat analysis scores the competitive advantage at 66 out of 100 (low confidence).
What moves the price
The last reported earnings sit well below what analysts expect (earnings in transition, for example after write-downs or an earnings dip); whether the stock is cheap or expensive hinges on the expected recovery actually arriving. Read the fair value with that caveat.
The share trades about 27% below its 52-week high and 53% above its 52-week low, currently below its 200-day average.
For context, the median of 10 Technology peers we cover trades at −46% fair-value upside, at −28%, CGNX screens cheaper than that median.
Fair Value models
All 26 models by family
Quality Score breakdown
It rates the business: profits, how they develop, real cash, balance sheet, investing and share count.
Insider trades
In the last 6 months, 4 officers or directors sold shares worth $16.6M and none bought.
- SaleMatthew MoschnerCEO & President, Director24,962 shares at $64.01$1.6MAug 11, 202610b5-1 plan
- SaleDarren Marc LongVice President20,252 shares at $66.34$1.3MMay 27, 2026
- SaleLaura Ann MacdonaldVP and PAO2× since Feb 12, 2026: 154,603 shares, avg. $65.54$10.1MMay 12, 2026
- SaleMark FennellChief Legal Officer &Secretary64,873 shares at $67.05$4.3MMay 11, 2026
- SaleDianne M ParrotteDirector44,000 shares at $54.00$2.4MMar 2, 2026
- SaleCarl GerstEVP, Global Sales and Products14,336 shares at $55.95$802,041Feb 23, 202610b5-1 plan
- SaleAngelos PapadimitriouDirector4,150 shares at $55.58$230,657Feb 23, 2026
- SaleJoerg KuechenHead of Corporate M&A61,900 shares at $56.03$3.5MFeb 20, 2026
- SaleRobert WillettDirector2× since Feb 12, 2026: 179,200 shares, avg. $58.40$10.5MFeb 13, 202610b5-1 plan
Plus 6 other filings such as grants, option exercises or tax withholding. They are not market purchases or sales.
Sales are often planned (taxes, diversification, 10b5-1 plans). Purchases with their own money are seen as the stronger sign. For information only: not part of the quality score or Fair Value.
Source: SEC Form 4, as of Nov 5, 2026. All filings at the SEC ↗
Revenue & earnings trend
Growth Forecast
CGNX screens overvalued: fair value 28% below the price. Compare with Keysight Technologies, Inc →
Recent news
- Cognex (CGNX) Could Be 33% Undervalued Following Record Q3 And Raised Outlook
- Cognex Corporation (CGNX) Q3 Earnings and Revenues Beat Estimates
- Cognex (NASDAQ:CGNX) reports Q3 2026 in line with expectations but stock drops
- Cognex Reports Third Quarter 2026 Results
Compare Cognex Corporation with another stock
Price, fair value, quality and upside side by side.
Peer GroupⓘHow this stock ranks against its industry: the green marker is this stock, the band is the typical 25–75% peer range, and the tick is the median.Scientific & Technical Instruments · 160 stocks
Valuation Multiplesvs Scientific & Technical Instruments median · lower = cheaper
Strength profile in five axes (Snowflake)
VALUE 0: the price sits above our fair-value range.
Context: sector, industry, market
- Is the Information Technology sector expensive or cheap?
- P/E, EV/EBITDA and margins by industry (reference tables)
- PEG ratio by industry
- Revenue growth by industry
- Stock screener with 62 metrics
- Undervalued stocks: US Stocks
- Valuation of the USA market
Values & ESG
Does this company touch areas you may want to avoid? The classification is inferred from sector and industry.
Similar stocks
10 more Scientific & Technical Instruments stocks, each showing price versus our Fair Value estimate.
| Stock | Price | Fair Value | vs Fair Value | Compare |
|---|---|---|---|---|
| Teledyne Technologies Incorporated TDY | $632.01 | $729.99 | +16% | vs CGNX |
| Garmin Ltd GRMN | $289.15 | $318.07 | +10% | vs CGNX |
| MKS Inc MKSI | $194.95 | $199.16 | +2% | vs CGNX |
| Codan Limited CDA | A$56.12 | A$53.80 | −4% | vs CGNX |
| Trimble Inc TRMB | $54.25 | $29.36 | −46% | vs CGNX |
| Fortive Corporation FTV | $68.34 | $35.67 | −48% | vs CGNX |
| Coherent Corp COHR | $195.09 | $92.95 | −52% | vs CGNX |
| Chroma ATE Inc 2360 | 1,335 TWD | 607.12 TWD | −55% | vs CGNX |
| Keysight Technologies, Inc KEYS | $285.86 | $117.27 | −59% | vs CGNX |
| AVIC Chengdu Aircraft Company 302132 | ¥70.58 | ¥12.60 | −82% | vs CGNX |
Explore undervalued stocks
More undervalued Technology stocks →
Try a ready-made strategy
Pick a strategy and jump into the live analysis with that exact screen applied.
Discover tools
For bloggers & editors: embed code + live data
For bloggers, editors and developers: paste this into your site or blog (a “Custom HTML” block in WordPress), it shows the current fair value and links back here. Free, plain HTML, and welcome. Full data streams (CSV/JSON) at /developers.
Cite: Fair Value Calculator (2026). "Cognex Corporation Fair Value". https://www.fairvalue-calculator.com/stock/CGNX
Frequently asked questions
Is Cognex Corporation (CGNX) overvalued or undervalued?
What is the fair value of CGNX?
What is the quality score of CGNX?
What is the price target for Cognex Corporation (CGNX)?
What is the Cognex Corporation stock forecast for 2026?
What is the revenue of Cognex Corporation (CGNX)?
Does Cognex Corporation pay a dividend?
What growth is priced into Cognex Corporation (CGNX)?
What discount rate (WACC) does the fair value of CGNX use?
What is a reverse DCF?
How much growth has Cognex Corporation (CGNX) delivered so far?
How fast is the sector of Cognex Corporation (CGNX) growing?
What is the free cash flow yield of Cognex Corporation (CGNX)?
What is the intrinsic value of Cognex Corporation (CGNX)?
Is Cognex Corporation stock overvalued or undervalued in 2026?
Is fair value the same as the market price of CGNX?
How much is Cognex Corporation worth?
What do the bullish and bearish scenarios say about CGNX?
What is the P/E ratio of CGNX?
What is the PEG ratio of CGNX?
How solid is the balance sheet of Cognex Corporation (CGNX)?
How far is CGNX from its 52-week high?
Which stocks are comparable to Cognex Corporation?
Is Cognex Corporation stock attractive at the current price?
How is the fair value of CGNX calculated?
Is it still worth investing in stocks now?
What is the share price of Cognex Corporation (CGNX)?
What should I pay attention to with Cognex Corporation right now?
Where does the earnings growth of Cognex Corporation (CGNX) come from?
Key figures of Cognex Corporation
How large is the market capitalisation of Cognex Corporation (CGNX)?
What is the P/S ratio of Cognex Corporation (CGNX)?
What are the earnings per share of Cognex Corporation (CGNX)?
What is the dividend yield of Cognex Corporation (CGNX)?
What is the net margin of Cognex Corporation (CGNX)?
What is the return on equity of Cognex Corporation (CGNX)?
What is the EBIT return on assets of Cognex Corporation (CGNX)?
What is the operating margin of Cognex Corporation (CGNX)?
How fast is revenue growing at Cognex Corporation (CGNX)?
How fast are earnings growing at Cognex Corporation (CGNX)?
How much net cash does Cognex Corporation (CGNX) hold?
Watch Cognex Corporation in the live analysis
One click puts Cognex Corporation on your watchlist: fair value and trend at a glance, plus comparison, the diversification check and the 27,000+ stock screener.
Watch for free →Zero risk: nothing is ever charged. Your watchlist is yours, with or without an account.