

Maritana Minerals Limited (MRT) fair value: what the stock is really worth
As of Nov 9, 2026: fair value (intrinsic value) of Maritana Minerals Limited stock A$0.37, price A$0.57, that is 35.2% below the price, quality 48 out of 100. Rating: strongly overvalued. Calculated from audited financials with 24 of our 26 valuation models and 37 quality factors, updated daily.
- Keep an eye on it?Free in your watchlist: 5 stocks without an account, 10 with one Yes, for free
 Thin data
Nov 8, 2026
Maritana Minerals Limited
MRT · AUOur calculation puts a fair price 35% below what the stock costs today.
What runs behind every stock
69 individual criteria per stock, every one traceable See the method →
Price vs Fair Value
White line = price, green steps = our fair value per fiscal year. As of Nov 8, 2026.
How to read this chart
60‑month range A$0.4200 – A$2.18 · fair‑value band A$0.2648 – A$0.4135 · the A$0.5650 price screens above the A$0.3659 fair value. Green steps = our fair value per fiscal year (point-in-time, no hindsight). As of Nov 8, 2026.
Every Wednesday you see whether Maritana Minerals is on track or worth a review, plus price against fair value. Free, up to 3 stocks.
We send you a confirmation link. Unsubscribe with one click.
Company profile
Maritana Minerals Limited engages in the exploration, development, and production of gold and other mineral resources in Australia. It primarily explores for gold, nickel, cobalt, silver, and zinc deposits.
Show moreShow less
The company was formerly known as Horizon Minerals Limited and changed its name to Maritana Minerals Limited in April 2026. Maritana Minerals Limited was incorporated in 1974 and is based in West Perth, Australia.
Stock analysis
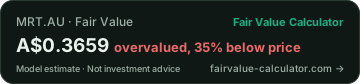
Maritana Minerals Limited (MRT) currently trades at A$0.5650, while our model-based Fair Value estimate is A$0.3659, 35% below the price, so the stock looks overvalued today.
Show more
Valuation
Bull case: the DCF Models group reads highest at a median of A$1.28 per share, and 22 of the 24 models we run sit above the A$0.5650 price.
Bear case: the Asset-Based group reads lowest at A$0.4600, and 2 of the 24 models stay below the price. Data coverage for this calculation is low.
Scenario range: A$0.2648 (bear) to A$0.4135 (bull), the price of A$0.5650 sits above it. Bear and bull are the same models on cautious and optimistic assumptions, a range, not a price target.
Quality & growth
The Quality Score stands at 48/100 (below-average quality), in the Basic Materials sector.
Mixed Growth: Revenue is growing, but margins or cash flow do not fully confirm the trend.
Maritana Minerals Limited reported revenue of A$80.6M in FY2026 versus A$3.3M in FY2022, a compound +121.9%/yr. Reported net income was A$62.9M in FY2026.
Key figures
Market cap A$211M (≈ $145M) Micro · P/E ratio 2.2 · P/S ratio 1.81 · EPS (TTM) A$0.2600 · Net margin 78.1% · Return on equity 29.3% · Return on assets (EBIT) −6.7% (5-year average) · Operating margin −25.1%.
Competitive moat
Our AI-assisted moat analysis scores the competitive advantage at 53 out of 100 (medium confidence).
What moves the price
The share trades about 63% below its 52-week high and 20% above its 52-week low, currently below its 200-day average.
For context, the median of 10 Basic Materials peers we cover trades at −12% fair-value upside, at −35%, MRT screens richer than that median.
Fair Value models
All 24 models by family
The fair value above starts from this blend and is adjusted for a cyclical peak year.
Quality Score breakdown
It rates the business: profits, how they develop, real cash, balance sheet, investing and share count.
Revenue & earnings trend
Growth Forecast
MRT screens overvalued: fair value 35% below the price. Compare with Newmont Corporation →
Compare Maritana Minerals Limited with another stock
Price, fair value, quality and upside side by side.
Peer GroupⓘHow this stock ranks against its industry: the green marker is this stock, the band is the typical 25–75% peer range, and the tick is the median.Gold · 206 stocks
Valuation Multiplesvs Gold median · lower = cheaper
Strength profile in five axes (Snowflake)
VALUE 0: the price sits above our fair-value range.
Context: sector, industry, market
- P/E, EV/EBITDA and margins by industry (reference tables)
- EBIT margin by industry
- P/S ratio by industry
- Stock screener with 62 metrics
- Undervalued stocks: Basic Materials
- Valuation of the Australia market
Values & ESG
Does this company touch areas you may want to avoid? The classification is inferred from sector and industry.
Similar stocks
10 more Gold stocks, each showing price versus our Fair Value estimate.
| Stock | Price | Fair Value | vs Fair Value | Compare |
|---|---|---|---|---|
| Agnico Eagle Mines Limited AEM | $191.57 | $220.07 | +15% | vs MRT |
| Newmont Corporation NEM | $120.91 | $133.00 | +10% | vs MRT |
| AngloGold Ashanti plc AU | $92.99 | $88.58 | −5% | vs MRT |
| Royal Gold, Inc RGLD | $265.81 | $248.53 | −7% | vs MRT |
| Shandong Gold Mining Co 600547 | ¥26.72 | ¥23.61 | −12% | vs MRT |
| Franco-Nevada Corporation FNV | $254.95 | $212.28 | −17% | vs MRT |
| Kinross Gold Corporation KGC | $22.24 | $18.00 | −19% | vs MRT |
| Northern Star Resources Limited NST | A$25.85 | A$16.87 | −35% | vs MRT |
| Wheaton Precious Metals Corp WPM | $136.31 | $87.64 | −36% | vs MRT |
| Zijin Mining Group 601899 | ¥28.41 | ¥15.62 | −45% | vs MRT |
Explore undervalued stocks
More undervalued Basic Materials stocks →
Try a ready-made strategy
Pick a strategy and jump into the live analysis with that exact screen applied.
Discover tools
For bloggers & editors: embed code + live data
For bloggers, editors and developers: paste this into your site or blog (a “Custom HTML” block in WordPress), it shows the current fair value and links back here. Free, plain HTML, and welcome. Full data streams (CSV/JSON) at /developers.
Cite: Fair Value Calculator (2026). "Maritana Minerals Limited Fair Value". https://www.fairvalue-calculator.com/stock/MRT
Frequently asked questions
Is Maritana Minerals Limited (MRT) overvalued or undervalued?
What is the fair value of MRT?
What is the quality score of MRT?
What is the price target for Maritana Minerals Limited (MRT)?
What is the Maritana Minerals Limited stock forecast for 2026?
What is the revenue of Maritana Minerals Limited (MRT)?
What growth is priced into Maritana Minerals Limited (MRT)?
What discount rate (WACC) does the fair value of MRT use?
What is a reverse DCF?
How much growth has Maritana Minerals Limited (MRT) delivered so far?
How fast is the sector of Maritana Minerals Limited (MRT) growing?
What is the free cash flow yield of Maritana Minerals Limited (MRT)?
What is the intrinsic value of Maritana Minerals Limited (MRT)?
Is Maritana Minerals Limited stock overvalued or undervalued in 2026?
Is fair value the same as the market price of MRT?
How much is Maritana Minerals Limited worth?
What do the bullish and bearish scenarios say about MRT?
What is the P/E ratio of MRT?
How solid is the balance sheet of Maritana Minerals Limited (MRT)?
How far is MRT from its 52-week high?
Which stocks are comparable to Maritana Minerals Limited?
Is Maritana Minerals Limited stock attractive at the current price?
How is the fair value of MRT calculated?
Is it still worth investing in stocks now?
What is the share price of Maritana Minerals Limited (MRT)?
What should I pay attention to with Maritana Minerals Limited right now?
Key figures of Maritana Minerals Limited
How large is the market capitalisation of Maritana Minerals Limited (MRT)?
What is the P/S ratio of Maritana Minerals Limited (MRT)?
What are the earnings per share of Maritana Minerals Limited (MRT)?
What is the net margin of Maritana Minerals Limited (MRT)?
What is the return on equity of Maritana Minerals Limited (MRT)?
What is the EBIT return on assets of Maritana Minerals Limited (MRT)?
What is the operating margin of Maritana Minerals Limited (MRT)?
How fast is revenue growing at Maritana Minerals Limited (MRT)?
How much net cash does Maritana Minerals Limited (MRT) hold?
Watch Maritana Minerals Limited in the live analysis
One click puts Maritana Minerals Limited on your watchlist: fair value and trend at a glance, plus comparison, the diversification check and the 27,000+ stock screener.
Watch for free →Zero risk: nothing is ever charged. Your watchlist is yours, with or without an account.