Find Financial Data for Fundamental Stock Analysis
Different ways to find the necessary financial data to fill into the Free Online Calculators or choose Unlimited Tool Access for automatically loaded data and instant calculations.
1.) Investors Relations
2.) Financial Websites
1. Find Financial Data from Investors Relations.
Google - Search
Financial Reports
Browse the PDF
It can be quite tricky to find financial data on your own. However, we would like to give you a hand. Search Google for “Investors Relations”. This section contains all quarterly and annual reports, as well as publications describing the company’s financial situation (usually in PDF format, which makes it easier to browse the document). The company’s own disclosures are the most accurate way to get financial metrics, as the data comes directly from the company itself.
Note that if you use quarterly reports instead of annual reports to find the relevant key figure, you usually have to calculate the key figure by 4 (quarters) before you can enter the fundamental key figure in one of the online calculators. Quarterly figures are often subject to seasonality and not every quarter is traditionally equally strong.
For example, some companies earn significantly more before Christmas or more in the summer season. All data that is important for fundamental stock analysis and stock valuation is automatically loaded and processed in our premium tool. This means you can call up the fundamental analyzes with all fundamental key figures from more than 45,000 stocks worldwide within seconds!
2.Find Financial Data from Financial Websites:


Financial websites also offer a good way to quickly find financial data and fundamental key figures for fundamental stock analysis. Providers such as Google Finance, Yahoo Finance, onvista.de or boerse.de offer a variety of practical financial data.
Usually the relevant data that you need for fundamental stock analysis is hidden under menu items such as: Fundamental data, fundamental key figures, finance, P&L, balance sheet or statistics. Once you have found the relevant key figures, you can use them in our free online calculators to evaluate stocks. Note that some metrics can fluctuate significantly from year to year. You can use the following calculator to calculate an average of the key figure (e.g. for earnings per share or cash flow per share).
Calculate the Average of Fundamental Key Metrics:
You can smooth any sequence of numbers in this calculator. All entered values are smoothed using the arithmetic and geometric mean and the median. (Note that all values entered must be positive.) This also irons out “outliers” in the number sequence and makes the fair value estimate / valuation of the company more accurate.
This is also how we proceed in our Premium Tool, in which decades-long histories of financial key figures are automatically used to calculate projections and accordingly offer fair values and valuations for more than 45,000 stocks worldwide. Easiest way to find financial data!
Average Growth Number Calculator:
This calculator calculates the growth from number to number and then calculates the arithmetic mean, geometric mean and median of the resulting growth numbers. (Note that all values entered must be positive.) The result is Growth, which is also required for our online calculators. Both sales figures for each year and earnings or earnings per share can be used to calculate an average growth figure.
In the Premium Tool, all short and long-term growth figures are automatically given for more than 45,000 stocks worldwide. Find financial data in a convenient way.
Example How to Find Financial Data Apple Stock.
Apple
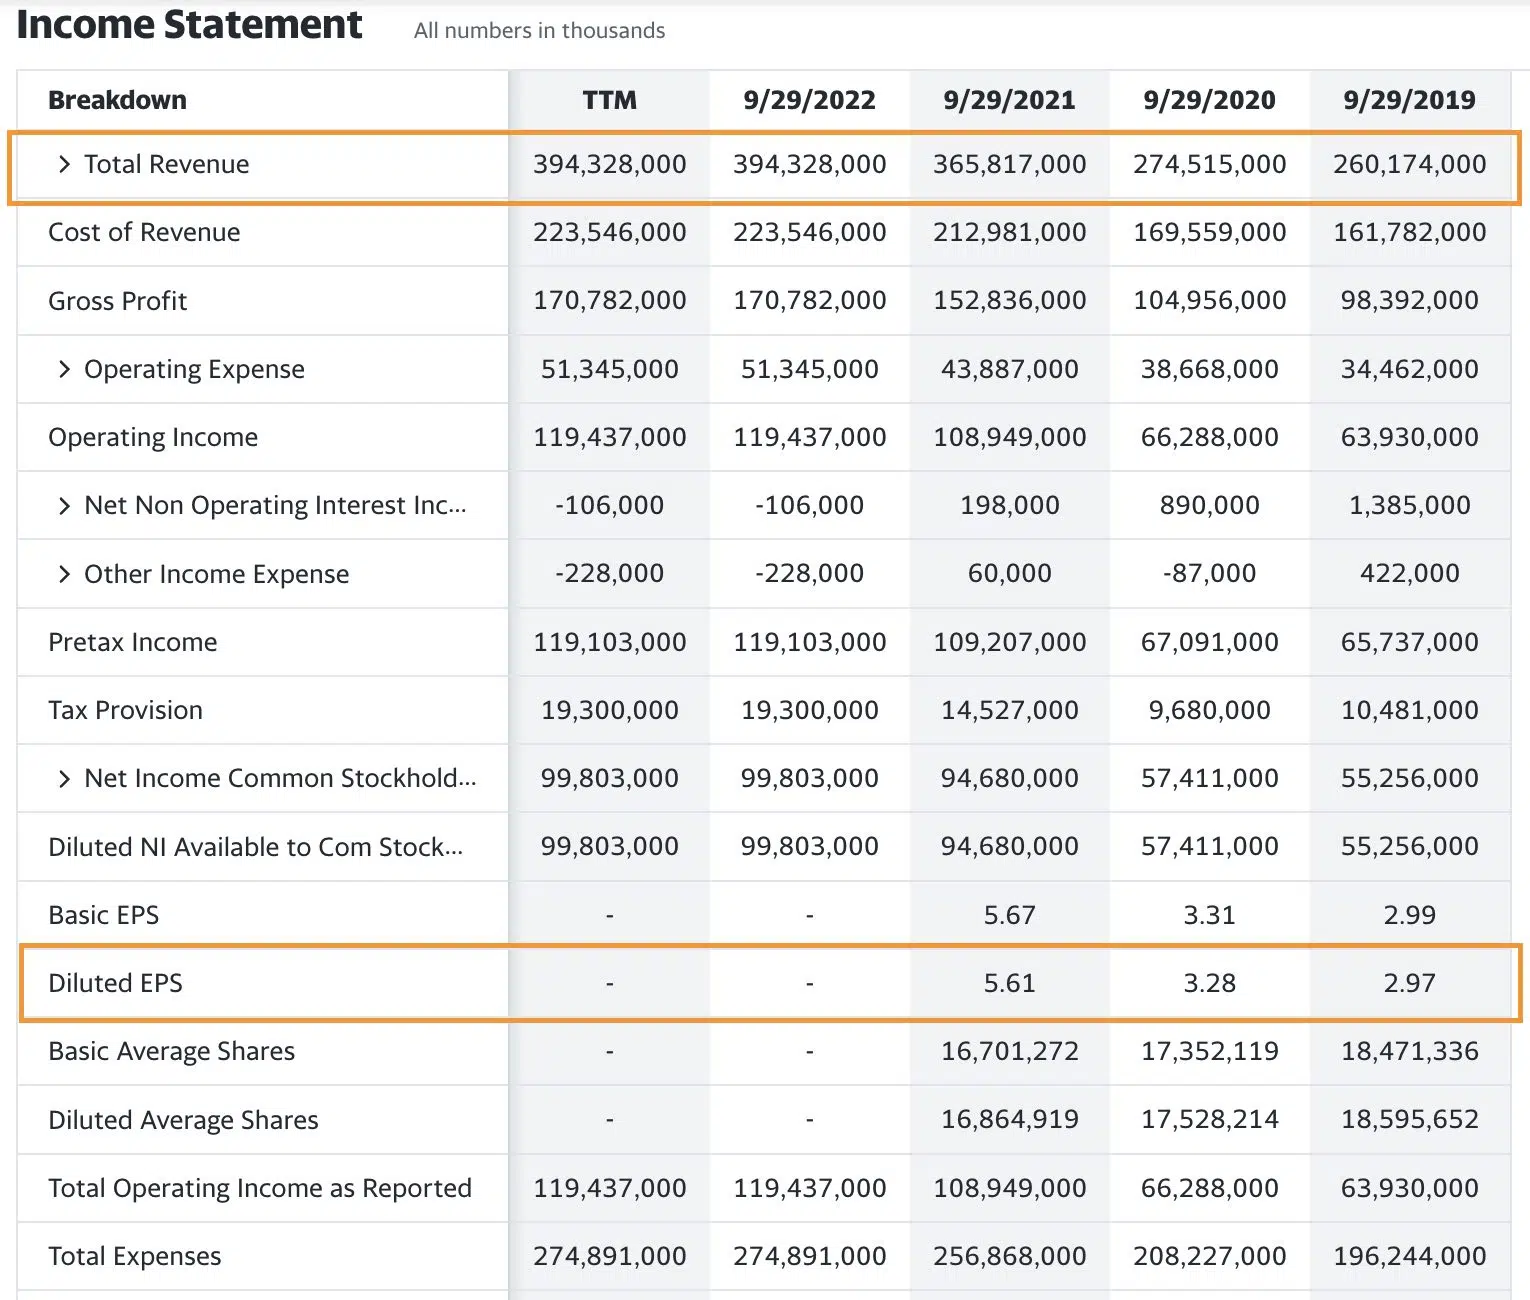
In this example, we tried to find financial data for Apple on Yahoo Finance. The following fundamental data can be found under the “Financials” tab. These fundamental metrics can be used in a variety of ways to evaluate stocks to determine their Fair Value relative to their stock price. Add the key figures to our online calculator. In the Premium Tool we do this work for you!
Calculate the Averages of EPS and Revenue Growth
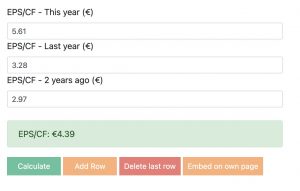
Earnings per share: To find the financial data for average earnings per share (EPS) you can use the supplementary calculator “calculate average of fundamental metrics”. Inputting the three diluted earnings per share from the years 2019, 2020 and 2021. The average EPS is now 4.39$.
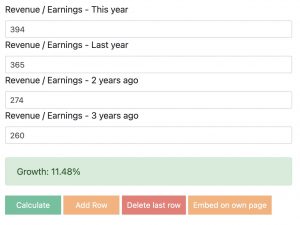
Revenue growth: Do the same with the revenue numbers by using the average growth calculator. The average revenue growth for the last 4 years is 11.48%.
These fundamental data can now be used everywhere on this website to calculate the Fair Value. Additionally you can use these fundamental key data to every aspect of fundamental stock analysis. Remember that all values must be positive and you can also use these average calculators for all kind of financial numbers and growth.
3.) Find Financial Data Automatically:
The easiest way to find financial data and check their fair value is our developed Fair Value Calculator with its Premium Tools. In our Premium Tools we load all the necessary financial key figures into a database to automatically, quickly, easily and clearly presented to evaluate. In addition, many practical tools are available for evaluating the overall market or individual sectors. You can also use the Stock Screener to search for undervalued stocks and set your own criteria to display exactly those stocks that fit your strategy.
FAQ: Find Financial Data
Quickly locate financial statements, ratios and per-share metrics for your analysis. Tips below ensure consistent periods, currencies and definitions.
Where do I start to find a company’s data?▾
Which period should I use: TTM, annual or quarterly?▾
- TTM: rolling last 12 months—best for a current snapshot.
- Annual: audited full-year comparability—use for long-term trends.
- Quarterly: helpful for seasonality—avoid mixing with annual when computing ratios.
How do currency and units work?▾
Are metrics consistent across IFRS and US GAAP?▾
Which share count is used for per-share data?▾
Where can I find the most-used data points quickly?▾
- Revenue, EBIT, EBITDA, Net income: Income Statement.
- Total debt, Cash, Equity: Balance Sheet (then build EV).
- Operating cash flow, Free cash flow: Cash Flow Statement.
- Margins and returns: use calculators like EBIT Margin and ROE.
How are dividends and stock splits handled?▾
What if a value looks missing or unusual?▾
How do I put raw data into quality and risk context?▾
How do I move from data to a valuation decision?▾
- Screen and open a company in Stock Screener.
- Build EV, compare EV/EBITDA and margins.
- Model scenarios in a DCF and set WACC in the Discount Rate Calculator.
- Manage sizing in the Portfolio Manager.