Evidence-Based High Quality & Premium Stock Analysis Tool.
We have done our homework and put the results of the Fairvalue-Calculator through their paces in every conceivable way. It's not about luck, it's about statistical facts.
Value Premium
Live Tests
Backtests
Sample Portfolios
Study of 100 stocks and the time they take to reach Fair Value.

This study of 100 stocks since 2015 shows that, on median, it takes about five years for the market price to converge back toward Fair Value. Fair Value refers to the fundamentally justified value of a stock — the price derived from its business figures and future prospects, independent of sentiment or speculation. Sometimes the price moves toward Fair Value, sometimes the fundamentals adjust, and often both happen at the same time. This principle is called mean reversion and highlights that patience and a long-term perspective are crucial for undervaluations in the market to pay off.
Four Paths of Mean Reversion.
In the four illustrations A–D you can see that not only can the price move toward Fair Value, but Fair Value can also adjust toward the price. In some cases, the price remains stable while only the fundamentals shift; in others, both move toward each other at the same time. These four variants demonstrate that mean reversion is not a rigid pattern but can take different paths by which price and Fair Value eventually converge.


Survival Curve – Time Until Convergence to Fair Value.

This curve shows how many stocks have not yet returned to their Fair Value after a given period of time. At the start, the share is naturally 100%, but within just a few years a large portion of stocks have already converged back to their fundamental value. As time goes on, the proportion of non-converged cases steadily declines, until after about ten years only a small remainder is left.
Empirical Evidence
Check below our backtests, livetests and historical studies as evidence for our method.
Simple random Sample 17y.
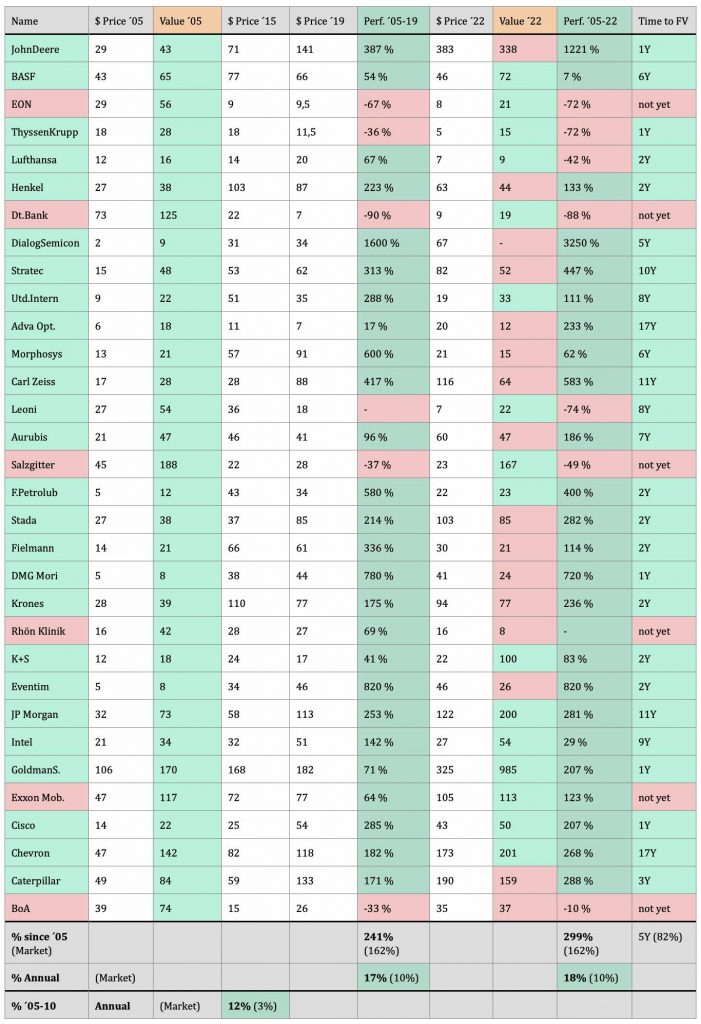
In this first sample we have chosen 32 stocks randomly from USA and Germany in the year 2005. All 32 stocks have shown a higher fair value back in 2005. From 2005 to 2010 these stocks performed with an average annual return of 12%. In the meanwhile the market (average of DAX and DOW indices) made 3%, quite a poor performance due to the financial crisis back in 2008. Nevertheless these Fair Value stocks could outperform the market by 9%. The same happened from 2005 to 2019 (7% outperformance) and from 2005 to 2022 (8% outperformance). With an average annual stock market performance of 9% and an outperformance of Fair Value stocks of 8% we could expect returns of 17% per year in the long run.
26 of the 32 stocks could reach their calculated Fair Values with impressive performances. The other 6 have not yet hit their Fair Values in these 17 years. Hitting Fair Value appears to happen after 5.5 years on average.

Update 2025 – Results of the Value Test
The evaluation of 32 value stocks purchased in 2005 below their fair value shows an impressive long-term performance. On average, these stocks gained about 846% by August 2025, while the overall market rose only around 162% over the same period. The median return stands at +180%, with the lower quartile at –29% and the upper quartile at +460%. This confirms what earlier studies and backtests had already indicated: undervalued stocks can significantly outperform the market in the long run. However, the results are highly heterogeneous – some names like Goldman Sachs and Eventim delivered far above-average gains, while others (e.g., Leoni or Salzgitter) lost value. Diversification therefore remains essential.
Increased Sample Size.
Now that you have seen how we tracked outperformance in the simple first test, here an automated test that we ran with the help of our database. Within the database we track more than 35000 stocks worldwide with their fair values and their relative performance to the market.
We ran innumerable automated test that always showed comparable results to the first simple test above. For sure it depends which markets and sectors you are invested in, but to choose the right market timing and sectors we also deliver the market- and sector-tool within our membership to help you with that.

The Importance of Holding Period
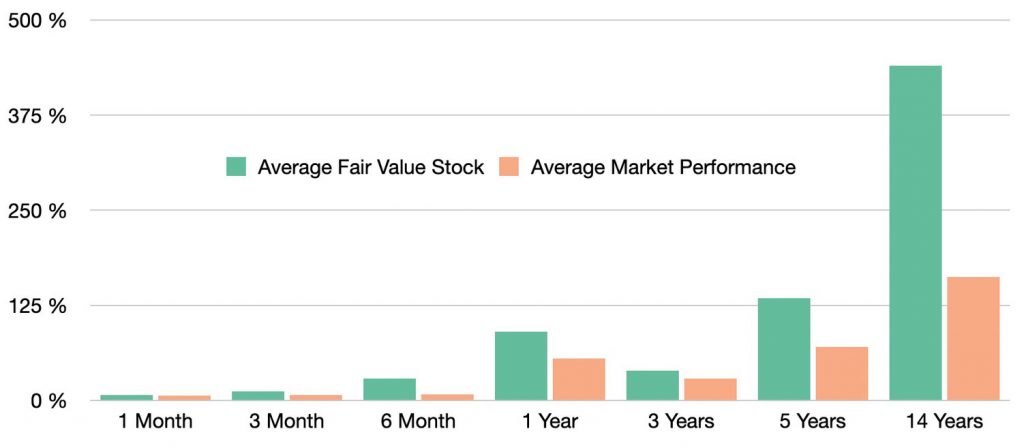
The analyzed data and scientific studies show that the outperformance of the value strategy is particularly strong during the first five years after purchase. In the backtests, the excess return over the market averaged about 9% per year from 2005 to 2010. After that, the advantage flattens out; from the tenth year onward, the additional return declines but remains positive. This can be explained by the fact that stock prices typically revert to their intrinsic value relatively quickly in the early years (mean reversion). Over the longer term, the effect diminishes because many stocks have already reached their fair value and then tend to move more in line with the overall market. The figure illustrates this pattern – it shows the average outperformance (percentage points per year) depending on the holding period: high in the early years, gradually decreasing later. For investors, the implication is clear: patience pays off, but the largest advantage arises in the early phase. Selling too early means missing out on the potential of a few very large winners.
Our long-term study shows that the Fair Value Factor delivers an average advantage of around +9% per year in the first five years after purchase, with a total outperformance of +846% versus only +162% for the market since 2005.
Studies about Value Investing.
A systematic review of literature and studies shows the same results as we found. Value investing is a promising way to identify great stocks.
Journal of Accounting Resaearch, Vol 38, 2000.
"Value Investing - The Use of Historical Financial Statement Information to seperate Winners from Losers."
Joseph Piotroski investigated value shares between 1976 and 1996. Based on fundamental analysis and an calculation of the true value of stocks based on historical data from the market reports of companies, the author assumes an annual outperformance of 7.5%.
As mentioned by Piotroski, FAMA 1998 shows that historical data from business reports are not priced in efficiently on the market. (This means that there seems to be an inefficiency between real market data and stock market prices, and this inefficiency allows opportunities to be identified and exploited for a higher returns in the portfolio.)
Frankel & Lee 1998.
"The strategy presented in Frankel & Lee requires investors to purchase stocks whose prices appear to be lagging fundamental values." - Over a 3-year period, Frankel and Lee showed that investing in undervalued stocks produced a higher return. (This underlines that Fair Value Stocks should be held for at least 3-5 years to hit their fair values.)
Warren Buffett.
"Price is what you pay, value is what you get.”
FAQ: Scientific Evidence Behind Our Tools
This page summarizes the empirical finance that underpins our screens and calculators, and how to apply it consistently in practice.
What do we mean by “scientific evidence” in investing?▾
Which effects have the strongest long-run support?▾
- Value: cheaper valuation ratios (e.g., EV/EBITDA, P/B) tend to outperform over full cycles.
- Quality/Profitability: higher margins, cash flow and balance-sheet strength (see Piotroski F-Score, ROE).
- Conservative investment: lower asset growth and prudent reinvestment often correlate with better subsequent returns.
- Risk control: excess leverage and weak solvency increase downside risk (check D/E, paydown years, Altman Z-Score).
How do we reduce data-mining and look-ahead bias?▾
- Use simple, economically-motivated ratios and rules.
- Apply out-of-sample validation across regions and time.
- Avoid look-ahead; align filings, TTM windows and rebalancing dates.
- Prefer lower-turnover implementations to keep the signal investable.
How do the tools map to the research?▾
- Value: Stock Valuation, EV/EBITDA, EV builder, P/S, P/B.
- Quality: F-Score, EBIT margin, ROE, EVA.
- Risk: D/E, Debt paydown years, Z-Score.
- Intrinsic value: DCF, plus rules-based checks such as Graham Number and Buffett Fair Value.
Does the evidence work in every year and market?▾
How do trading costs and taxes affect results?▾
How do I keep inputs methodologically clean?▾
- Match periods (TTM vs annual) and scope (consolidated vs parent).
- Use one policy for leases, minorities and cash across all peers.
- Reconcile EV items in the EV Calculator before comparing multiples.
What robustness checks do we consider best practice?▾
- Out-of-time/region tests, walk-forward validation.
- Include delisted names; avoid survivorship bias.
- Reasonable rebalance schedules and capacity constraints.
- Report drawdowns, not just averages.
How do I turn evidence into a buy/hold/sell call?▾
- Screen in the Stock Screener for value and quality.
- Build EV and compare EV/EBITDA.
- Model scenarios with a DCF and set a required return.
- Decide and size in the Portfolio Manager.
Is this investment advice, and is the past predictive?▾
Unleash Your Stock Data Instantly.
100% Satisfaction - 0% Risk - Cancel Anytime.