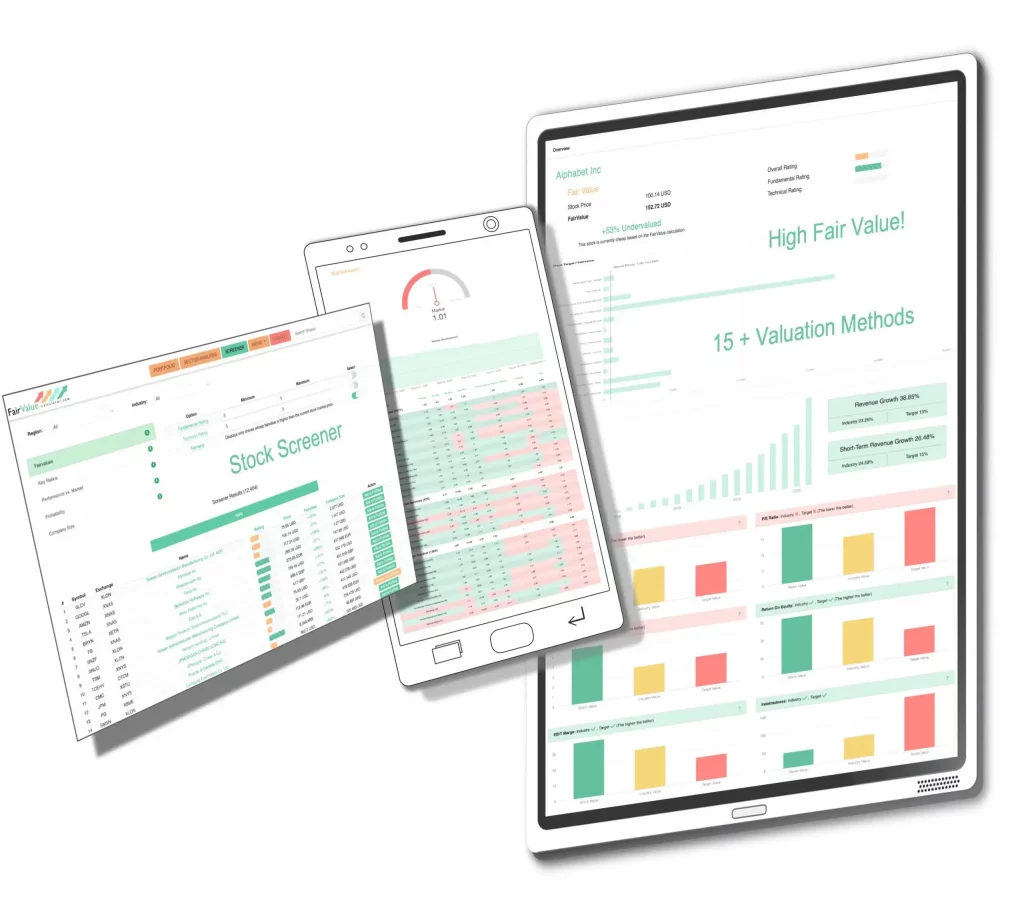
Stock Valuation
Objective models. Real data. Transparent assumptions.
In the Fair Value Stocks Database, in addition to market and industry data for the overall stock market, numerous data points for each individual stock are also available.
With over 45,000 stocks in the database and millions of data points, the tools can identify undervalued stocks worldwide.
Fifteen different valuation models generate an estimation of the fair value. Stocks that have a higher fair value than their current market price should be considered for purchase.
Additional valuation and quality tools provide quick and easy information about the stock.
What are good fair value stocks?
Good stocks according to the Fair Value Calculator strategy exhibit positive quantitative and qualitative characteristics, as well as an attractive valuation. Investments should be made in such stocks during favorable market conditions. The Fair Value Calculator assists in identifying these stocks, suitable industries, and the appropriate market environment.
High Fair Value
Fundamental Strength
Sales Growth
Great Performance
Top 10 Stocks: Fair Value Strategy
This list is updated daily by our Stock Screener Tool, covering more than 60,000 stocks worldwide. Discover this and many other Top-Lists inside the Fairvalue Calculator Premium Tool – try it now for free!
High Fair Value / Intrinsic Value
Fair Value: The true intrinsic value of the stock, which is compared to the current market price. The deviation from the current market price is represented in percentages, and depending on whether the stock is currently undervalued or overvalued, the deviation is depicted as undervalued or overvalued.
- Is the stock worth more than its current cost?
Fundamental Strength
Fundamental, Technical, and Overall Evaluation: The overall evaluation combines the fundamental and technical assessment. It encompasses both fundamental characteristics and the trend of price development in the stock market. The color coding allows for quick identification of whether each characteristic applies to the stock.
- Does the stock have good fundamental metrics and is the stock price moving favorably?
Sales Growth
In addition to solid fundamental metrics, increasing revenue growth is also one of the key factors that contribute to a good stock. Long-term and short-term growth numbers are available for each stock, which in turn influence the Fair Value. Furthermore, a sector comparison and general target for this metric are directly accessible.
- Does the stock have consistent and steady growth?
Great Performance
In addition to fundamental stock analysis, technical aspects are also considered in the stock evaluation. This allows for a quick assessment of whether the stock has performed well in a long-term uptrend based on the chart. An additional technical evaluation provides information on how well the stock has performed compared to the overall market.
- Has the stock outperformed the overall market?

Recent News
View current news about the respective stock and access the corresponding company profile to quickly get an overview of the latest updates about the company.

How the Fair Value is Calculated
A variety of valuation models are applied to each stock to determine the average Fair Value. Furthermore, all fundamental metrics are taken into account, which are visible both in the peer group comparison and in the online calculators.
Peer Groups
With the multiples, you can compare the important financial metrics with representatives of the same industry. Finding stocks that compare better to their peers is crucial in stock valuation!

FAQ: Stock Valuation
From multiples to DCF: build a fair-value range, define a margin of safety, and act with context.
What exactly does this page help me do? ▾
Which valuation methods are supported? ▾
Which inputs matter most in a DCF? ▾
How should I pick a discount rate or required return? ▾
Why favor EV/EBIT and EV/EBITDA over headline P/E? ▾
How do I handle cyclicality and one-offs in results? ▾
How do I interpret the output: fair value, upside and MoS? ▾
Common pitfalls to avoid when valuing a stock ▾
- Mixing TTM with forward inputs inconsistently.
- Ignoring dilution (stock-based comp, convertibles).
- Not adjusting for one-offs or working-capital swings.
- Comparing multiples across sectors without context.
How do market and sector context improve decisions? ▾
What’s a practical workflow in the tool? ▾
- Context: Check market and sector levels.
- Value: Model a base/bear/bull in the DCF Calculator.
- Cross-check: Compare EV/EBIT and peers using the EV Calculator.
- Decide: Size the position only if MoS is sufficient for the risk.


