Price to Cashflow P/CF Ratio Calculator
Price to Cashflow P/CF Ratio Calculator and Formula.
Insert the Stock Price and the cashflow per Share (cash flow divided by total shares outstanding – alternatively divide the market capitalization by total cashflow) into this Price to cashflow P/CF Ratio Calculator. Learn how to find fundamental data.
Top 10 Highly Profitable Stocks:
This list is updated daily by our Stock Screener Tool, covering more than 60,000 stocks worldwide. Discover this and many other Top-Lists inside the Fairvalue Calculator Premium Tool – try it now for free!
What is Price to Cashflow?
Price to Cash Flow or P/CF Ratio as it is known is a relative valuation metric that uses the share price and the cash flow per share of a company to determine whether the company is undervalued or overvalued as compared to its peers as well as the industry average. P/CF ratio is very useful where the company has a positive cash flow (cash coming in) but is recording an accounting loss due to high non-cash expenses (depreciation).
The Price to Cash Flow Ratio (P/CF) is a key valuation metric that compares a company’s stock price with the cash flow it generates per share. Unlike earnings, which can be distorted by non-cash items such as depreciation, amortization, or one-time write-offs, cash flow represents the actual money coming into the business. This makes the P/CF ratio particularly valuable for evaluating companies that report accounting losses but still generate positive liquidity.
A lower P/CF ratio can indicate that a stock is undervalued and that investors are paying relatively little for each unit of cash flow. On the other hand, a higher ratio suggests that the market is placing a premium on the company’s ability to generate cash, which may be justified in the case of high-growth businesses. Because cash flow is often more stable than reported earnings, the P/CF ratio is seen by many investors as a more reliable gauge of intrinsic value, especially in capital-intensive industries or during volatile market cycles.
Investors typically use the P/CF ratio in three ways: to compare companies within the same industry, to track a single company over time, and to evaluate whether the market is overpricing or underpricing a firm’s future cash-generating ability. It also complements other valuation ratios such as Price to Earnings (P/E) or Price to Book (P/B), offering a more rounded picture of financial health.
Two Practical Tips for Investors:
Use sector benchmarks: A “low” P/CF ratio in one industry may not be attractive in another. Always compare companies against their direct peers and the industry average to avoid misleading conclusions.
Look beyond the headline ratio: A very low P/CF may signal undervaluation, but it could also indicate problems such as declining cash flows, high debt, or unsustainable business models. Combine the ratio with trend analysis and other financial indicators before making an investment decision.
 Ratio Calculator 1")
P/CF Formula:
Formula:
P/CF Ratio = Stock Price / Cash Flow Per Share
or
P/CF Ratio = Market Capitalization of the Company / Total Cash Flow of the Company
All values are available in the financial statements of companies (Investors Relations on the Company’s website). Cash flow is available in the cash flow statement. It can also be calculated by adding all non-cash expenses (Depreciation and amortization) to the net profit/loss of the company. At its core, the P/CF ratio highlights what the market is pricing investors willing to pay for each unit of cash flow per share.
E.g. a share price of € 100 and a Cash Flow per Share of € 10 has a P/CF of 10. This means that you are willing to pay € 10 per € 1 of cash flow per share. When comparing the P/CF of one company with its peers and industry, you determine whether you are paying more for that cash flow or less. You want to be paying less so that when the market recognizes the stock’s fair value, you get higher returns.
Cashflow per Share Calculator:
Price to Cashflow Example:
P/CF is a pretty nifty ratio in that it can highlight good companies in asset-intensive sectors that have high churn in assets and consequently high depreciation. A high depreciation causes good cash flow to be hidden as it eats up the earnings due to its non-cash expense nature.
To highlight P/CF, we shall compare companies across a capital-intensive sector: Utilities. We shall focus primarily on electricity generation in the United States of America and are considering the top companies by revenue: Exelon, Duke Energy, and American Electric Power. We shall look at the P/CF of these companies and compare them with their performance over the last year. As with other ratios, P/CF is independent of currency as long as both Price and cash flow are in the same currency.
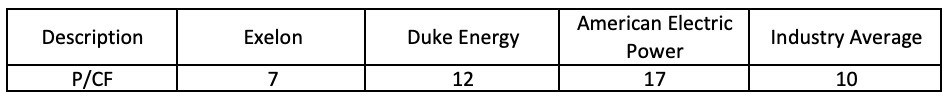
Right off the bat, Exelon has a P/CF below industry average as well as its peers. It is considered undervalued as investors need to pay only $7 per $1 of cash flow instead of $10 which is the industry average. Duke Energy is slightly higher and can be considered slightly overvalued as investors are expected to pay $12 per $1 of cash flow instead of $10. American Electric Power is considered highly overvalued commanding $17 per $1 cash flow per share. This high valuations are subsequently reflected in their performance.
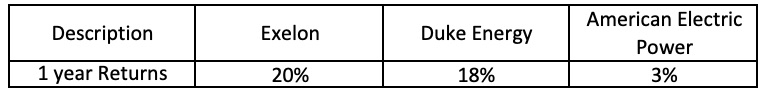
As expected American Electric Power has performed very poorly and Exelon has performed relatively better when compared to its peers. However, a simple P/CF ratio is not enough for performance. The company in consideration has to demonstrate its ability to bring in that cash flow and the revenue and earnings growth of our companies is as below:
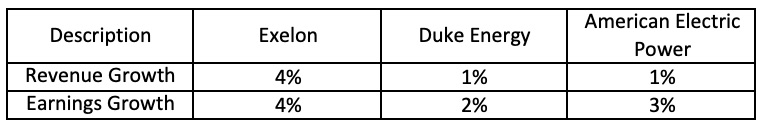
As one can see, Exelon has demonstrated excellent revenue and earnings growth, outshining its peers considerably thus leading to a relatively excellent performance.
What you should be looking for:
One of the best advantages of using cash flow and thus P/CF to evaluate companies is that it is extremely hard to manipulate cash flow. Unlike other ratios like P/S, P/B, and even P/E which depend on sales, asset value, and earnings, P/CF can shine a much truer picture of the company’s health. Sales can be manipulated by aggressive accounting or high discounts, asset value can be manipulated via different depreciation methods and subjective estimates.
Earnings numbers can be massaged as well by managing non-cash expenses as well as including other income. Cash flow however cannot be manipulated. Cash has to come in and go out and that record cannot be tampered with. All fundamental issues with the company like problems in operations, poor margins, high debt, and revenue not being realized are reflected in the cash flow statement and valuation metrics considering cash flow tend to perform better in terms of accuracy of investment decisions.
P/CF has its fair share of drawbacks as well. It has to be compared within the industry as certain industries like consumer durables and luxury goods tend to have high cash flows and thus lower P/CF and others like steel or utilities tend to have higher P/CF. The type of cash flow being considered can also vary basis person to person. Some take only Free Cash Flow (Cash Flow after accounting for capital expenditure and working capital) and some take the whole cash flow into account. These are all minor issues however and on an overall basis, the advantages far outweigh the drawbacks.
A low P/CF ratio is the ideal ratio you should be looking for. Within the industry, the lowest P/CF is considered highly undervalued. However as discussed in our other calculators, no single ratio is the holy grail of financial analysis. One must build a consensus with other financial ratios and valuation metrics to arrive at an investment decision. One thing to be taken into note while looking at a low P/CF ratio is company size and whether that low ratio is due to a one-time large cash flow.
A large company has a size advantage in its operations and economies of scale on its side thus leading to larger revenues and cash flows. A small company displaying a low P/CF is something that must be looked at deeply to understand whether the company is generating that large cash due to its operations or through something else.
Cash flow statements also contain cash flows due to debt and equity issues (i.e. selling shares to the public). A large equity issue or large debt inflow will lead to a large cash flow number and thus low P/CF. If that is the case, one must take an average of this year’s and last year’s cash flow numbers to smoothen out the one-time cash flow. Alternatively, focus only on operational cash flows for all companies and not on financing and investments.
Conclusion:
P/CF is a superior valuation metric that can bypass all manipulation tactics used by companies to hide their subpar performance. It has its drawbacks but the advantages far outweigh them. The important point is to focus on the right cash flow and ignore those coming from equity issues or debt. However no single ratio is enough to make an investment decision.
One must look at other metrics like Price to Book value and Price to earnings along with many others to arrive at a consensus of valuation. We have over 12 such key financial ratio calculators on our website, all available for free. Calculate the key ratios and build a consensus through them to determine whether a company is truly undervalued or overvalued.
Alternatively, join our Premium Tools and we will do all of this work for you, providing you with various fair values right on your very own premium dashboard.
In my experience, P/CF is pretty useful as a final consensus builder. Companies that usually cook their books or manipulate their numbers tend to have a rosy picture not only in their income statement and sometimes their balance sheet but also in their financial ratios.
However, if one can sift through the cash flow and sort out the numbers, one will be able to calculate and compare the P/CF ratio which if it supports other financial ratios firmly confirms that the company under consideration is solid and will help with your investment decisions regarding the company being undervalued or overvalued.
That does not mean however that if the ratio is not in line with others, the company is hiding something. That just means that one needs to go back and study the business in detail, try and spot any discrepancy in what the management is saying and what is being demonstrated in their numbers and operations, and move along the trail from there.
FAQ: Price-to-Cash-Flow (P/CF) Calculator
See how much the market pays for each unit of operating cash flow. Lower P/CF = cheaper (all else equal).
What is P/CF in one line?▾
How is P/CF calculated here?▾
- Per share: Price per share ÷ Operating cash flow per share.
- Company level: Market cap ÷ Operating cash flow (CFO).
- Use diluted shares for per-share inputs for consistency.
Operating cash flow or free cash flow?▾
Which period should I use?▾
How do I interpret the value?▾
When is P/CF most useful—and when not?▾
- Most useful: depreciation-heavy or capital-intensive industries where earnings are depressed by D&A.
- Use caution: financials, firms with volatile working capital, or negative/erratic CFO; cross-check with EV/EBITDA and a DCF.
Common mistakes to avoid▾
- Mixing quarterly CFO with a spot price while using annual shares.
- Ignoring large, non-recurring cash items or M&A effects.
- Using basic instead of diluted shares per share.
Quick workflow with this page▾
- Enter price, shares and CFO to get P/CF (and optionally P/FCF).
- Compare vs peers and history on Stock Valuation.
- Cross-check with EV/EBITDA after computing clean EV in the EV Calculator; model details in the DCF Calculator.
Is this investment advice?▾
Get Your Unlimited Access NOW!
100% Satisfaction - 0% Risk - No Credit Card.