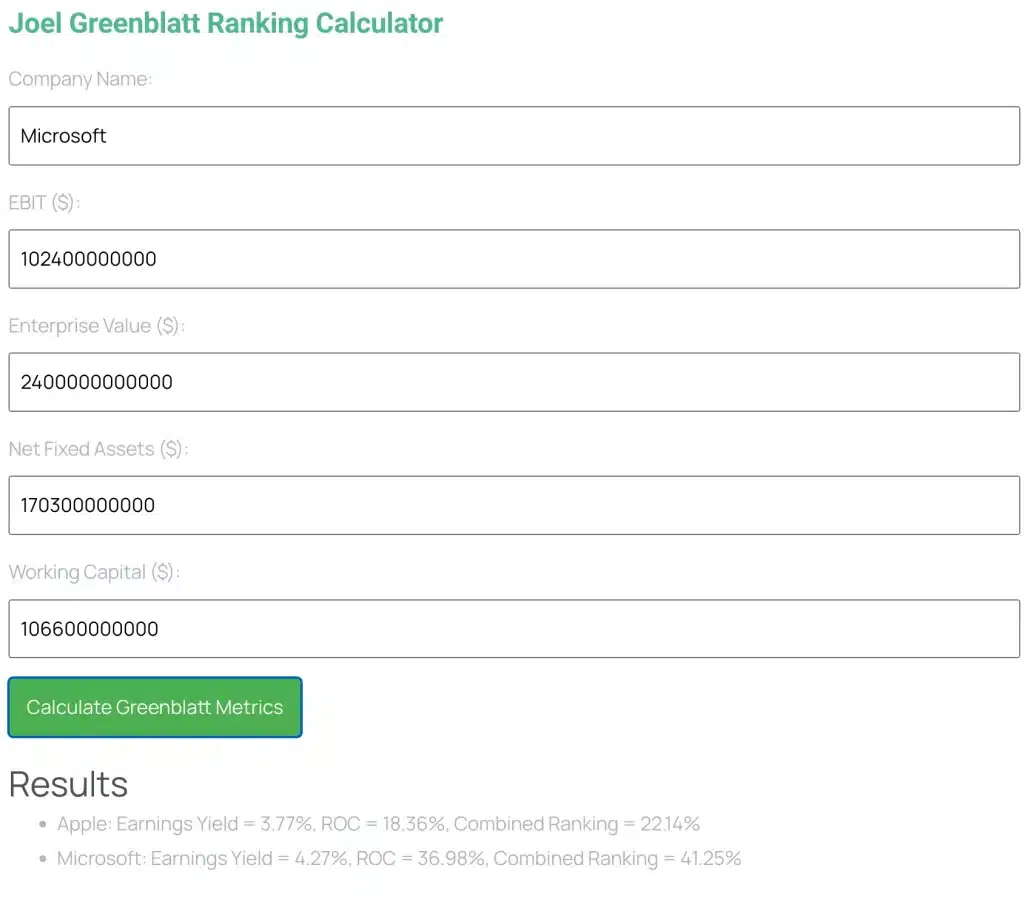
Joel Greenblatt Magic Formula Ranking
Ranking Calculator, Magic Formula & "The Little Book That Beats The Market"
Results
Joel Greenblatt Magic Formula Ranking Calculator
Joel Greenblatt, born in 1957 in New York, embarked on a remarkable journey that led him to become a renowned figure in the world of finance. A Harvard University graduate with an MBA, Greenblatt began his career as an investment banker at Morgan Stanley before venturing into entrepreneurship. In 1983, he took a bold step by founding his own investment firm, Gotham Capital. However, it was his groundbreaking book, “The Little Book That Beats The Market,” that truly catapulted him to global fame.
The book introduced the Magic Formula, a method of ranking stocks based on the sum of earnings yield and return on capital, proving to be a game-changer for investors. During the period from 1988 to 2004, before the financial crisis struck, Greenblatt achieved an astonishing average annual return of 30.8%. This remarkable feat surpassed the S&P 500 Index’s performance in the same timeframe by more than threefold, solidifying his reputation as a masterful investor. Explore the secrets behind Greenblatt’s success and unlock the potential for financial growth.
Top 10 Stocks: Greenblatt Strategy
This list is updated daily by our Stock Screener Tool, covering more than 60,000 stocks worldwide. Discover this and many other Top-Lists inside the Fairvalue Calculator Premium Tool – try it now for free!
The Little Book That Beats the Market
Greenblatt’s investment strategy is rooted in Value Investing, an approach that seeks to acquire undervalued stocks. He employs a unique method for evaluating stocks, which he aptly named the Magic Formula. The Magic Formula is built on two straightforward metrics:
EBIT/EV: The ratio of Earnings before Interest and Taxes (EBIT) to Enterprise Value (EV), also known as Earnings Yield.
Return on Capital (ROC): The return on invested capital.
According to Greenblatt, stocks with high EBIT/EV and ROC values are considered undervalued. He strategically acquires these stocks and holds onto them for the long term. Uncover the insights behind Greenblatt’s Magic Formula and discover the potential for identifying investment opportunities in undervalued assets.
Joel Greenblatt: Microsoft and Apple


Joel Greenblatt Magic Formula
Joel Greenblatt’s “Magic Formula” is an investment strategy presented in his book, “The Little Book That Still Beats the Market.” The formula combines two financial metrics, Earnings Yield and Return on Capital, to evaluate companies.
The concept is to identify companies that are attractive both in terms of earnings relative to market value and exhibit a high return on invested capital. The formula is expressed as follows: Magic Formula Rank = Earnings Yield Rank + Return on Capital Rank.
Unlock the potential of Greenblatt’s Magic Formula and explore how it can guide you in identifying companies with a compelling combination of earnings and return on capital for investment success.

Joel Greenblatt's Perspective on Dividends
Joel Greenblatt, a prominent value investor and author of “The Little Book That Beats the Market,” expounds his views on dividends within the framework of his renowned “Magic Formula.” This strategy, detailed in his book, has historically led to outperforming the stock market.
Within Greenblatt’s Magic Formula, one of the key metrics is dividend yield. He regards dividends as a form of “yield guarantee,” providing investors with a consistent payout irrespective of stock price fluctuations.
Greenblatt contends that dividend payments serve as a significant signal of a company’s quality. His argument posits that companies consistently distributing dividends typically possess robust business models and solid earnings. Through his research, Greenblatt has observed that companies with high dividend yields generally outperform the broader stock market.
This outperformance is likely attributed to the lower risk profile of these companies and their ability to provide investors with a steady income stream. Encouraging investors to allocate a portion of their portfolios to dividend-paying stocks, Greenblatt believes these stocks offer an excellent avenue for regular returns while minimizing risk.
Several direct statements from Joel Greenblatt emphasize his stance on dividends: “Dividends are a gift from heaven,” “Dividends are one of the reasons I buy stocks,” and “Dividend stocks are one of the best ways to generate regular income.” In summary, Greenblatt is a staunch advocate for dividends, viewing dividend-paying stocks as an effective means to achieve consistent returns while simultaneously mitigating risk.


💬 Comment by Dr. Peter Klein, Founder of Fairvalue Calculator:
Joel Greenblatt’s famous “Magic Formula” is one of the simplest quantitative approaches in investing. It ranks stocks based on just two factors: earnings yield and return on capital. The brilliance lies in its clarity — investors finally had a straightforward system that could be applied without endless variables.
In reality, though, the formula works best as a starting point rather than a complete strategy. Markets change, accounting standards differ, and companies often find ways to manipulate the metrics. That’s why I prefer a broader perspective when analyzing stocks.
On our platform, the Premium Tool doesn’t rely on just one formula. Instead, it combines 15+ valuation models and automatically weights them — Greenblatt’s method included. This makes the outcome much more robust and reliable.
Greenblatt deserves credit for inspiring a generation of investors with his straightforward system. But in practice, diversification across valuation methods is key — that’s the philosophy behind Fairvalue Calculator.
Why Investors Using Greenblatt Rankings Should Consider the Fair Value Calculator:
If you use Joel Greenblatt’s ranking strategy to find attractive stocks, you’re already focusing on profitable, efficiently managed companies. But Greenblatt’s method only tells you what ranks well – not whether a stock is fairly priced. This is where the Fair Value Calculator becomes essential.
Our proprietary model calculates the true intrinsic value of any stock by combining earnings, cashflow, growth, margins, and book value – offering a clear answer to the question:
Is this ranked stock actually undervalued or already overpriced?
Use the Fair Value Calculator to:
Analyze your ranked stocks more precisely
Avoid buying overvalued companies despite a good Greenblatt score
Make smarter investment decisions with professional, automated valuation
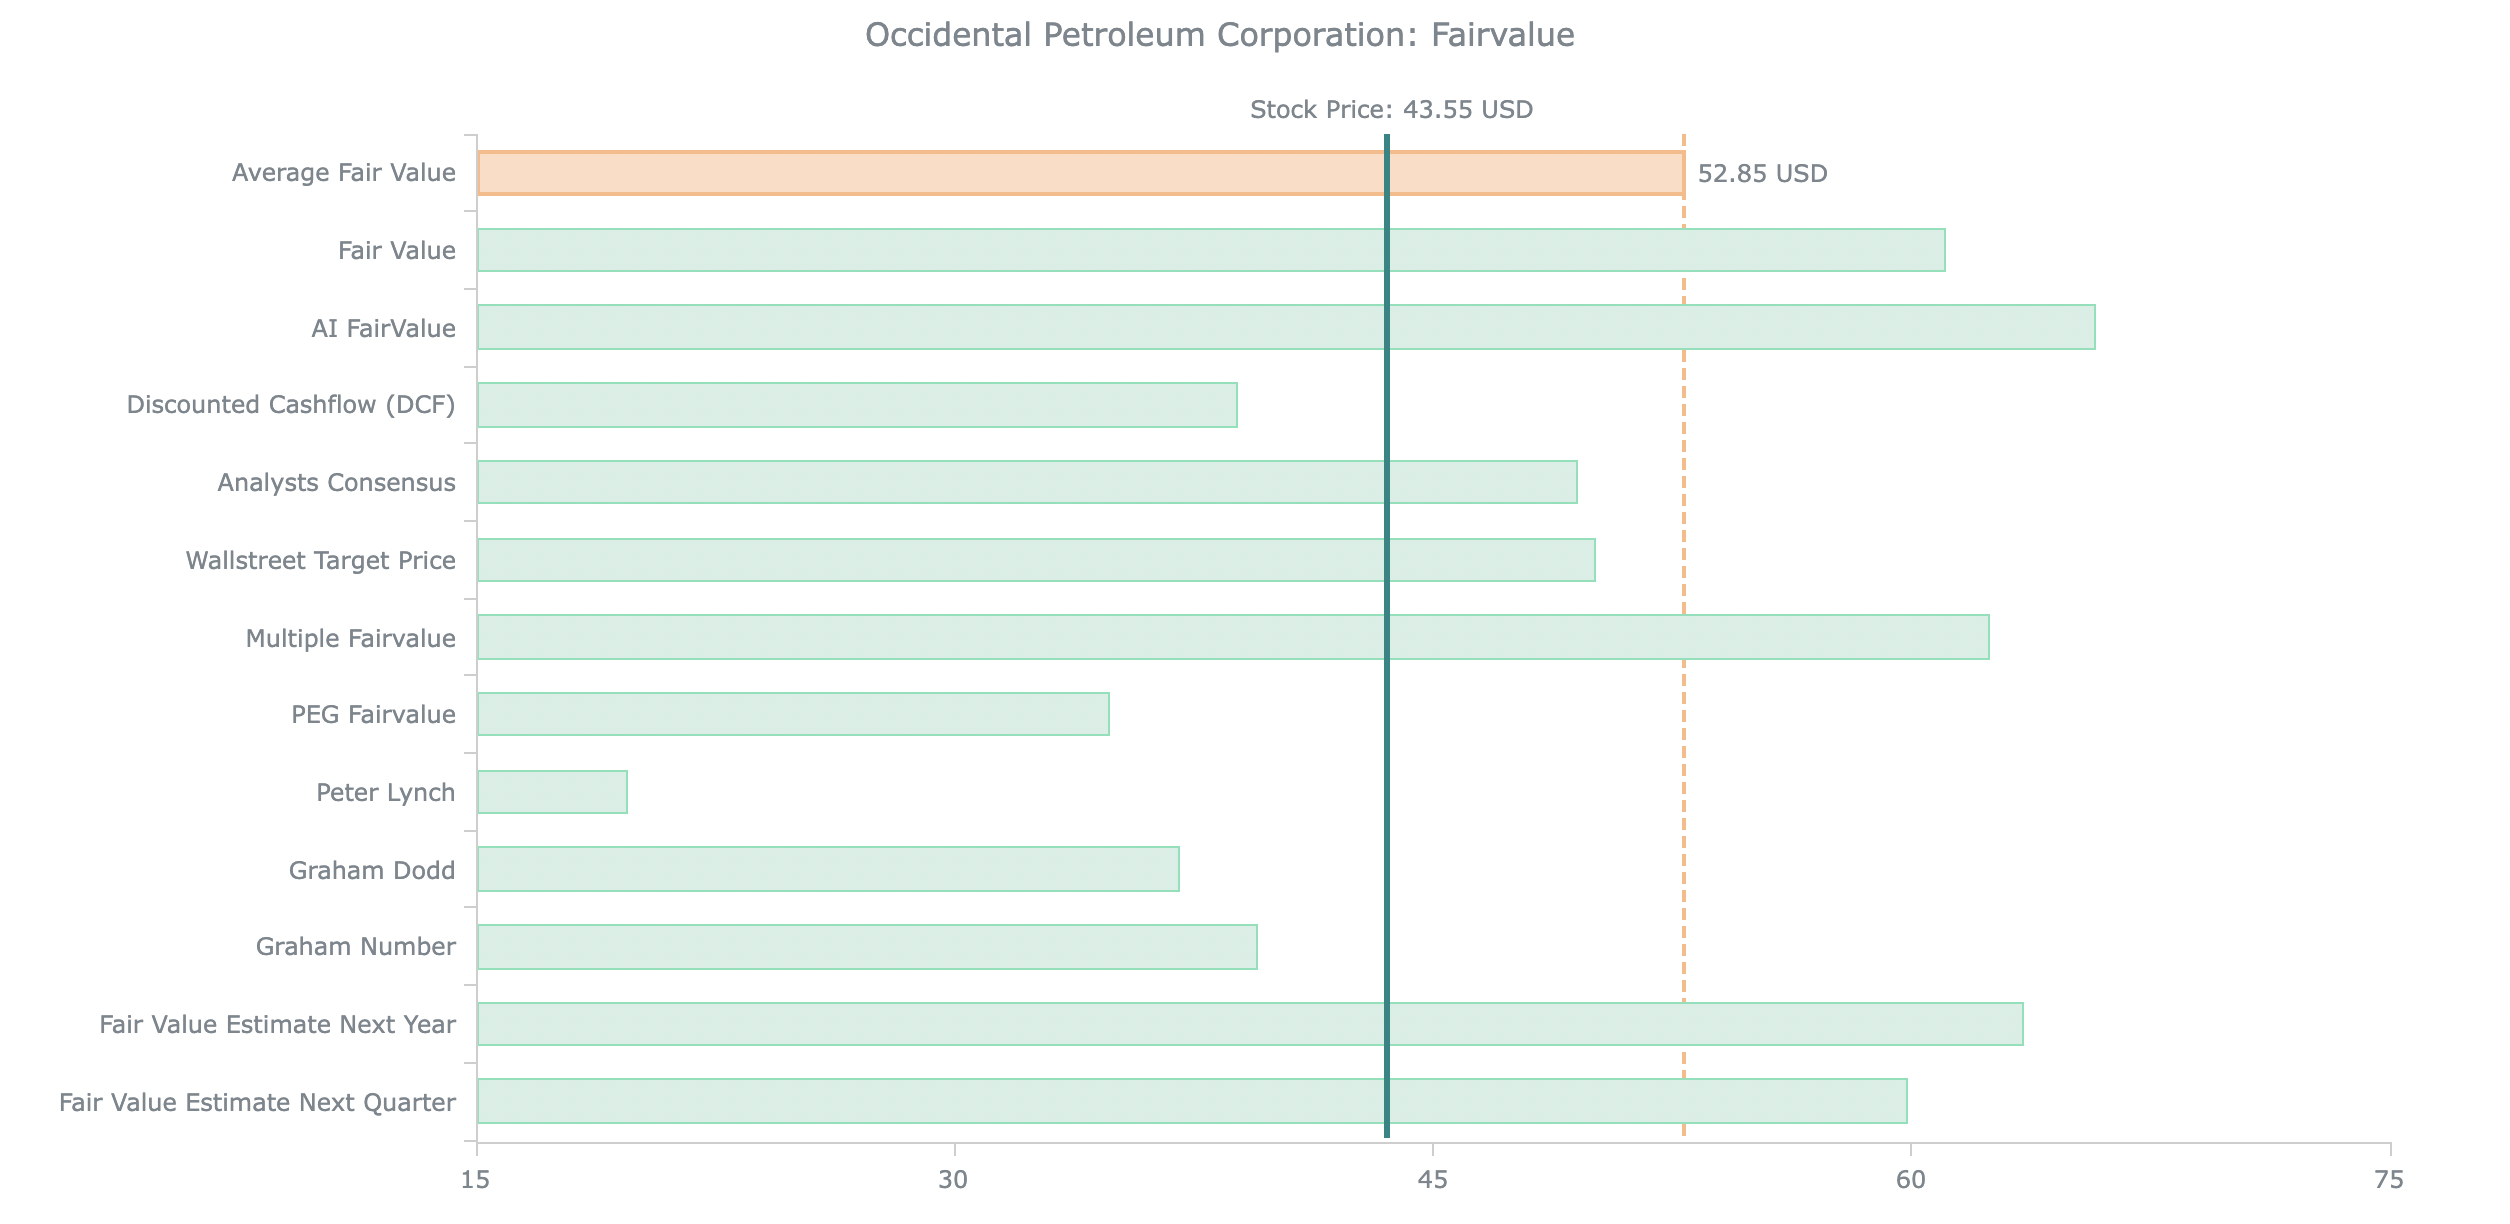
The chart below shows how we combine classic models like DCF, PEG Ratio, Peter Lynch, Graham, and AI-based calculations into a single clear fair value – helping you decide whether a Greenblatt-ranked stock is actually worth buying right now.
FAQ: Joel Greenblatt Ranking (Magic Formula)
Screen and rank stocks by Earnings Yield and Return on Capital, then validate winners with clean EV and a deeper valuation.
What is the Greenblatt (Magic Formula) ranking? ▾
How do we compute Earnings Yield here? ▾
How is Return on Capital defined in this context? ▾
How is the final rank calculated? ▾
Which filters should I apply before ranking? ▾
- Exclude micro-caps and illiquid names (set market cap and volume floors).
- Remove firms with negative EBIT or distressed balance sheets.
- Optionally focus on your target regions/sectors for better comparability.
Should I compare ranks across all sectors? ▾
What are the next steps after I have the top ranks? ▾
- Deep dive: Build cases in the DCF Calculator.
- EV checks: Compute clean EV and review EV/EBIT.
- Combine signals in Stock Valuation.
TTM or forward—what should I use for inputs? ▾
Any cases where the formula struggles? ▾
- Negative EBIT or heavy one-offs.
- Extreme leverage or non-operating assets/liabilities distorting EV.
- Industries with unusual accounting (consider extra checks).
How do I turn ranks into a diversified portfolio? ▾
Where do I get candidates to rank? ▾
Is this investment advice? ▾
Greenblatt-Model and Many More
Find all Valuation Models in Our Premium Tools:

