
Advanced Methods and Modern Applications
In the recent unprecedented market volatility and technological transformation, calculating a stock’s intrinsic value has become more crucial—and more complex—than ever. This comprehensive guide explores both traditional valuation methods and cutting-edge approaches, incorporating real-world examples and practical applications for today’s investment landscape.
Understanding Intrinsic Value in Modern Markets
The Evolution of Value Investing
Warren Buffett’s famous quote, “Price is what you pay, value is what you get,” remains relevant, but the conception of value has evolved significantly. Today’s intrinsic value calculations must account for:
- Intangible assets (intellectual property, brand value, network effects)
- Digital transformation potential
- ESG considerations
- Network effects and platform economics
- Global market interconnectedness
The Gap Between Price and Value
Market inefficiencies create opportunities when stock prices deviate from intrinsic value. Common causes include:
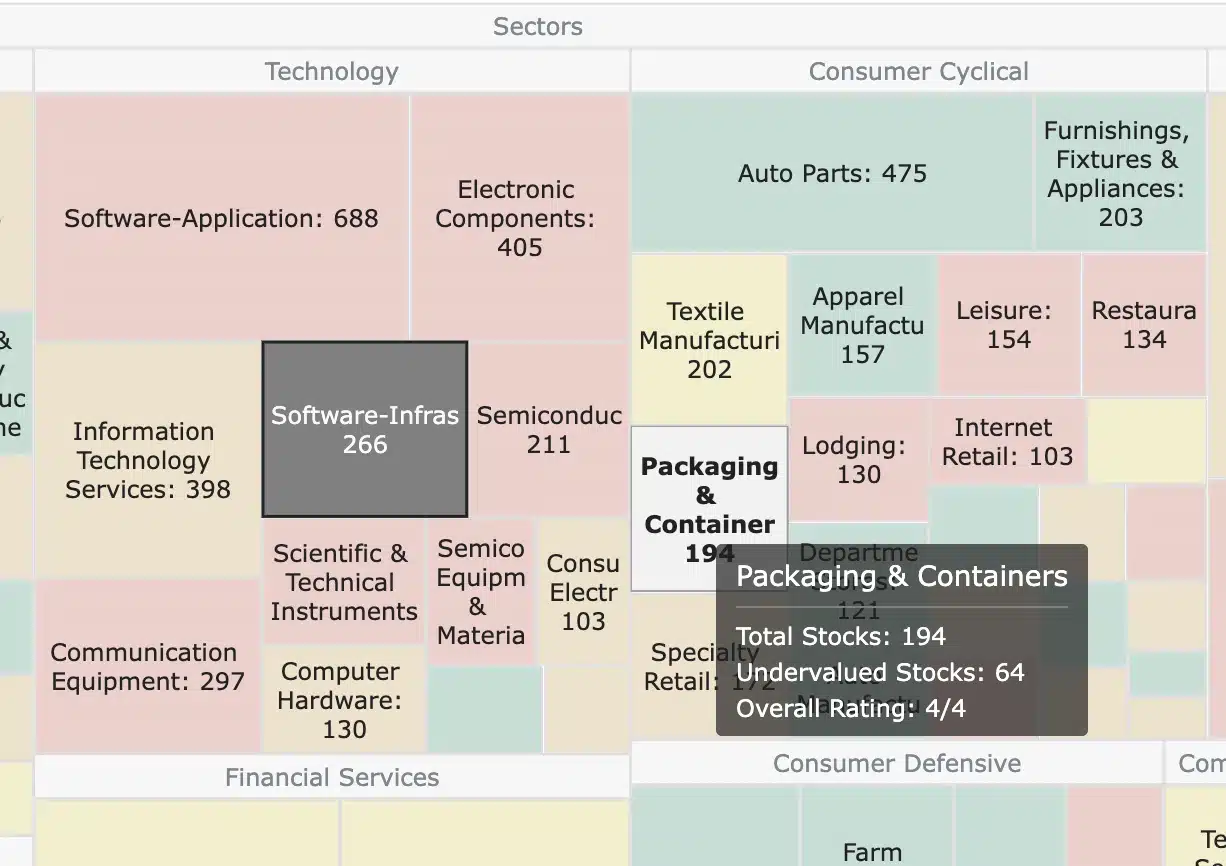
Explore our most popular stock fair value calculators to find opportunities where the market price is lower than the true value.
- Peter Lynch Fair Value – Combines growth with valuation using the PEG ratio. A favorite among growth investors.
- Buffett Intrinsic Value Calculator – Based on Warren Buffett’s long-term DCF approach to determine business value.
- Buffett Fair Value Model – Simplified version of his logic with margin of safety baked in.
- Graham & Dodd Fair Value – Uses conservative earnings-based valuation from classic value investing theory.
- Intrinsic vs. Extrinsic Value – Learn the core difference between what a company’s really worth and what others pay.
- Intrinsic Value Calculator – A general tool to estimate the true value of a stock, based on earnings potential.
- Fama-French Model – For advanced users: Quantifies expected return using size, value and market risk.
- Discount Rate Calculator – Helps estimate the proper rate to use in any DCF-based valuation model.
- Behavioral biases (recency bias, herd mentality)
- Short-term market sentiment
- Technical factors (index inclusion/exclusion)
- Temporary business disruptions
Comprehensive Valuation Methods
1. Advanced DCF Analysis
Multiple Scenario DCF
Consider three scenarios:
💡 Discover Powerful Investing Tools
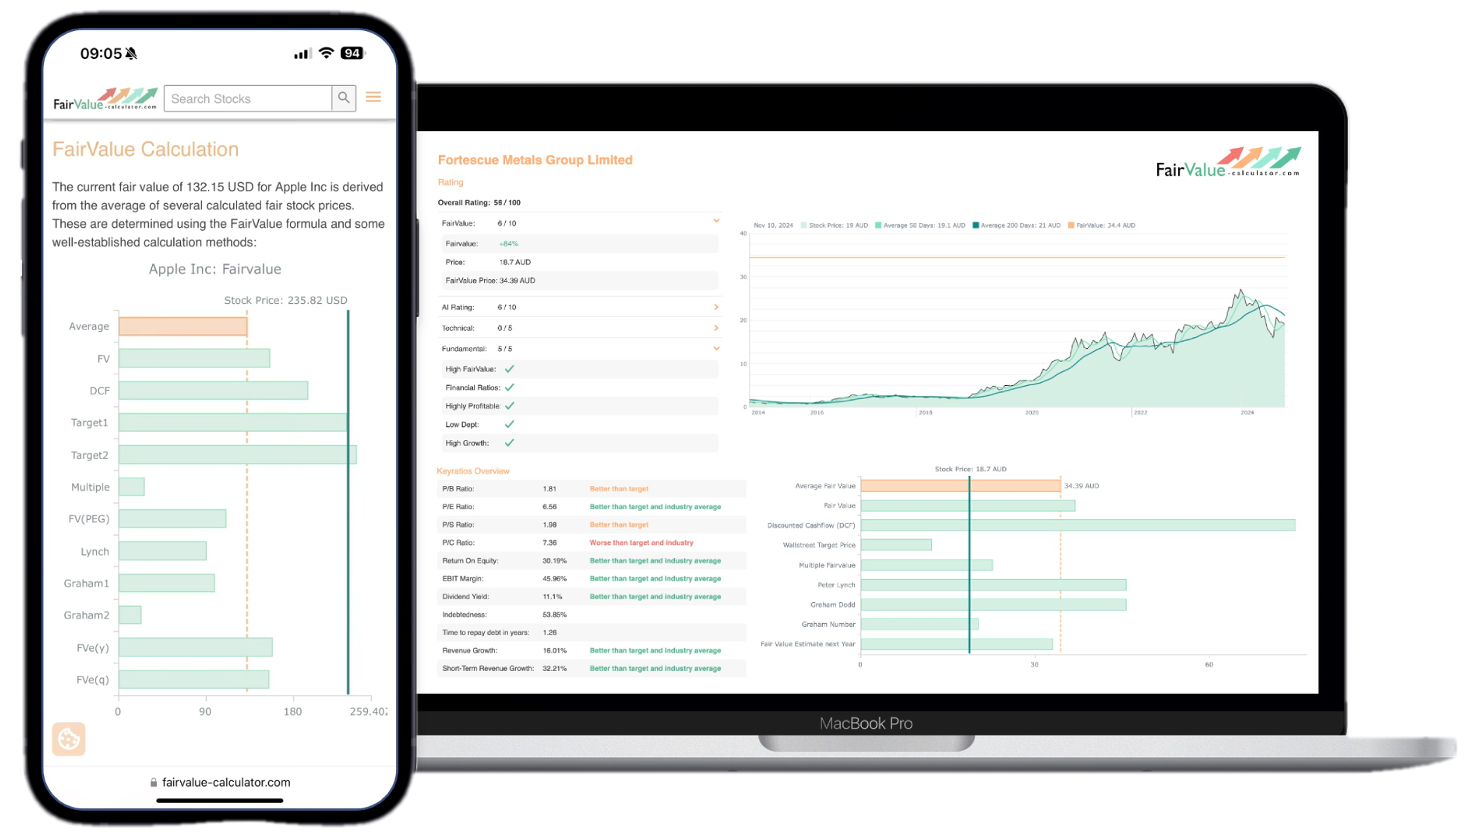
Stop guessing – start investing with confidence. Our Fair Value Stock Calculators help you uncover hidden value in stocks using time-tested methods like Discounted Cash Flow (DCF), Benjamin Graham’s valuation principles, Peter Lynch’s PEG ratio, and our own AI-powered Super Fair Value formula. Designed for clarity, speed, and precision, these tools turn complex valuation models into simple, actionable insights – even for beginners.
Learn More About the Tools →- Base Case: Expected performance
- Bull Case: Optimistic growth and margin expansion
- Bear Case: Conservative estimates and potential disruptions
Example:
Tesla (TSLA) Multiple Scenario Analysis:
Base Case:
- Revenue Growth: 25% annually
- Operating Margin: 15%
- Terminal Growth: 3%
Intrinsic Value: $210/share

Bull Case:
- Revenue Growth: 35% annually
- Operating Margin: 20%
- Terminal Growth: 4%
Intrinsic Value: $350/share

Bear Case:
- Revenue Growth: 15% annually
- Operating Margin: 10%
- Terminal Growth: 2%
Intrinsic Value: $120/share
Probabilistic DCF
Assign probabilities to different scenarios:

- Base Case: 60% probability
- Bull Case: 20% probability
- Bear Case: 20% probability
Weighted Average Intrinsic Value = ($210 × 0.6) + ($350 × 0.2) + ($120 × 0.2) = $220/share
2. Advanced Dividend Discount Models
Multi-Stage Dividend Growth Model
For companies with varying growth phases:
Phase 1: High Growth (Years 1-5)
Phase 2: Transition (Years 6-10)
Phase 3: Mature Growth (Terminal)
Example:
Johnson & Johnson (JNJ) Analysis:
Phase 1: 8% dividend growth
Phase 2: 5% dividend growth
Phase 3: 3% dividend growth
Required Return: 9%
Current Dividend: $4.50

Calculated Intrinsic Value: $165/share
3. Asset-Based Valuation
The modern asset-based valuation must consider:
Tangible Assets
- Property, plant, and equipment
- Inventory
- Cash and investments
- Accounts receivable
Intangible Assets
- Patents and Trademarks
- Brand value
- Customer relationships
- Data assets
- AI/ML capabilities
Example:
Microsoft (MSFT) Intangible Asset Valuation:
- Patent Portfolio: $50B
- Brand Value: $100B
- Customer Relationships: $80B
- Cloud Infrastructure: $150B
- AI/ML Capabilities: $70B
Total Intangible Value: $450B
Modern Valuation Considerations
1. ESG Impact Analysis
ESG factors significantly influence valuation multiples:
Environmental Factors
- Carbon footprint
- Resource efficiency
- Renewable energy adoption
- Waste management
Social Factors
- Labor practices
- Community relations
- Product Safety
- Data privacy
Governance Factors
- Board diversity
- Executive compensation
- Shareholder rights
- Risk management
Example ESG Premium Calculation:
Industry Average P/E: 15x
ESG Score Impact:
- High ESG Score (80+): +20% premium
- Medium ESG Score (50-79): No adjustment
- Low ESG Score (<50): -20% discount
2. Technology Disruption Analysis
Evaluate disruption potential using:
Digital Transformation Score
- Digital revenue percentage
- AI/ML implementation
- Cloud adoption
- Digital customer engagement
Innovation Metrics
- R&D investment
- Patent portfolio
- Technical talent
- Innovation pipeline
Example:
Retail Sector Analysis:
Traditional Metrics:
- P/E Ratio
- Sales Growth
- Operating Margins

Digital Transformation Adjustments:
- E-commerce Revenue: +0.5x multiple for every 10% of digital sales
- AI Implementation: +0.3x multiple for advanced AI adoption
- Omnichannel Capabilities: +0.2x multiple for mature capabilities
Practical Implementation Guide
1. Data Collection Framework
Financial Data
- 10-K and 10-Q reports
- Earnings call transcripts
- Industry reports
- Competitor analysis
Market Data
- Trading volumes
- Short interest
- Institutional ownership
- Options market indicators
Alternative Data
- Satellite imagery
- Credit card data
- Mobile app usage
- Social media sentiment
2. Valuation Process Steps
Initial Screening
- Financial health metrics
- Growth trajectory
- Competitive position
- Market opportunity
Detailed Analysis
- Historical performance review
- Peer comparison
- Industry analysis
- Management assessment
Forecasting
- Revenue projections
- Margin analysis
- Capital requirements
- Working capital needs
Valuation Synthesis
- Multiple methods application
- Scenario analysis
- Sensitivity testing
- Final value range determination
3. Risk Assessment Framework
Company-Specific Risks
- Business model sustainability
- Management quality
- Financial leverage
- Customer concentration
Industry Risks
- Competitive dynamics
- Regulatory environment
- Technological change
- Economic sensitivity
Market Risks
- Interest rate sensitivity
- Currency exposure
- Liquidity risk
- Systematic risk factors
Case Study: Tech Sector Valuation
Example: Cloud Computing Company
Base Assumptions:
- Revenue Growth: 30% CAGR
- Gross Margin: 75%
- Operating Margin: 25%
- R&D Investment: 15% of revenue
- Sales & Marketing: 30% of revenue

Valuation Adjustments:
1. Technology Premium
   - Market Leadership: +15%
   - Innovation Pipeline: +10%
   - Network Effects: +20%

2. Risk Factors
   - Competition: -10%
   - Customer Concentration: -5%
   - Regulatory Risk: -5%

Final Valuation Range: $80-100 per share
Advanced Tools and Resources
Valuation Software
- Financial modeling platforms
- AI-powered analytics tools
- Industry databases
- Scenario analysis software
Data Sources
- Financial terminals (Bloomberg, FactSet)
- Alternative data providers
- ESG rating agencies
- Market intelligence platforms
Conclusion
Calculating intrinsic value in 2025 requires a holistic approach that combines traditional fundamental analysis with modern considerations. Success depends on:
- Rigorous quantitative analysis
- Understanding of qualitative factors
- Integration of modern valuation frameworks
- Regular updates and adjustments
- Consideration of multiple scenarios
- Risk management integration
The most effective valuations will combine multiple approaches while remaining flexible enough to incorporate new information and changing market conditions. Remember that intrinsic value is dynamic and requires constant monitoring and adjustment as new information becomes available.


Dane Lutz
Pretty! This has been a really wonderful post. Many thanks for providing these details.
Blair Goodwin
I was recommended this website by my cousin I am not sure whether this post is written by him as nobody else know such detailed about my trouble You are amazing Thanks
Mylie Skinner
Hi there to all, for the reason that I am genuinely keen of reading this website’s post to be updated on a regular basis. It carries pleasant stuff.
Cloe Ward
You’re so awesome! I don’t believe I have read a single thing like that before. So great to find someone with some original thoughts on this topic. Really.. thank you for starting this up. This website is something that is needed on the internet, someone with a little originality!
Connor Lynch
Your writing is not only informative but also incredibly inspiring. You have a knack for sparking curiosity and encouraging critical thinking. Thank you for being such a positive influence!
Judith Horton
I am truly thankful to the owner of this web site who has shared this fantastic piece of writing at at this place.
punta cana seasons
I’m often to blogging and i really appreciate your content. The article has actually peaks my interest. I’m going to bookmark your web site and maintain checking for brand spanking new information.
Leandro Turner
Very well presented. Every quote was awesome and thanks for sharing the content. Keep sharing and keep motivating others.
Tianna Carter
You’re so awesome! I don’t believe I have read a single thing like that before. So great to find someone with some original thoughts on this topic. Really.. thank you for starting this up. This website is something that is needed on the internet, someone with a little originality!
Yaritza Ochoa
Very well presented. Every quote was awesome and thanks for sharing the content. Keep sharing and keep motivating others.
Madelyn Riley
This was beautiful Admin. Thank you for your reflections.