

Riwi Corp (RIWI) fair value: what the stock is really worth
As of Nov 10, 2026: fair value (intrinsic value) of Riwi Corp stock C$0.13, price C$0.23, that is 40.5% below the price, quality 41 out of 100. Rating: strongly overvalued. The value is an estimate: none of our valuation models currently carries, it draws on revenue and assets compared with similar companies. Updated daily.
- Keep an eye on it?Free in your watchlist: 5 stocks without an account, 10 with one Yes, for free
 Thin data
Nov 10, 2026
Riwi Corp
RIWI · VOur calculation puts a fair price 41% below what the stock costs today.
What runs behind every stock
69 individual criteria per stock, every one traceable See the method →
Price vs Fair Value
White line = price, green steps = our fair value per fiscal year. As of Nov 10, 2026.
How to read this chart
60‑month range C$0.1300 – C$1.95 · fair‑value band C$0.1004 – C$0.1673 · the C$0.2250 price screens above the C$0.1338 fair value. Green steps = our fair value per fiscal year (point-in-time, no hindsight). As of Nov 10, 2026.
Every Wednesday you see whether Riwi is on track or worth a review, plus price against fair value. Free, up to 3 stocks.
We send you a confirmation link. Unsubscribe with one click.
Company profile
RIWI Corp. operates as a trend-tracking and prediction technology firm in the United States, Europe, Canada, and internationally. Its patented cloud-based software solution provides a digital intelligence platform to clients seeking real-time consumer and citizen sentiment data.
Show moreShow less
The company offers subscription products, such as RIWI compass to gauge the extent of political, macroeconomic, and geopolitical risks; RIWI voices of Ukraine monitor that access insights on the availability of food, medical supplies, electricity, and financial assistance; and Clinician and Patient Experience Registry (CaPER), a platform that captures invaluable perspectives that empowers healthcare stakeholders with actionable, real-time insights.
It also provides data solutions, including RIWI track for capturing and assessing large samples of data; RIWI test, a message testing tool; RIWI audience to scale online engagement of content marketing, educational platforms, and other initiatives; RIWI rapid response that assess critical situations; and RIWI omni to source answers to a questions using random domain intercept technology, as well as advertising, packaging, and product solutions.
In addition, the company offers CoolTool, a platform for neuromarketing and market research; RIWI Sampling Technologies, including random domain intercept technology; RIWI Respondent Marketplace provides river sampling, allowing researchers to access profiled data; and RIWI Communities that offers online survey respondents, in-person participants, social media sentiment, or specialized B2B audiences.
The company serves government and public sectors, financial services and economics, healthcare and life sciences, international development, and consumer services industries, as well as academic institutions and independent researchers.
RIWI Corporation was incorporated in 2009 and is headquartered in Toronto, Canada.
Stock analysis
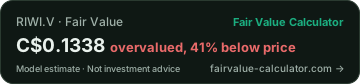
Riwi Corp (RIWI) currently trades at C$0.2250, while our estimate is C$0.1338, 41% below the price, so the stock looks overvalued today.
Show more
Valuation
None of our valuation models currently carries for this company, usually because of losses or heavy investment. The estimate draws on revenue and assets compared with similar companies and is less precise than a model-based fair value.
Scenario range: C$0.1004 (bear) to C$0.1673 (bull), the price of C$0.2250 sits above it. Bear and bull are the same models on cautious and optimistic assumptions, a range, not a price target.
Quality & growth
The Quality Score stands at 41/100 (below-average quality), in the Technology sector.
Expensive Growth: The company is growing, but growth may require heavy reinvestment or weak cash conversion.
Riwi Corp reported revenue of $5.7M in FY2025 versus $4.1M in FY2021, a compound +8.2%/yr. Reported net income was −$2.2M in FY2025.
Key figures
Market cap C$6.4M (≈ $4.5M) Micro · P/S ratio 1.48 · EPS (TTM) C$−0.1700 · Net margin −39.4% · Return on equity −210% · Return on assets (EBIT) −23.8% (5-year average) · Operating margin −46.8% · Revenue (TTM) $4.3M.
Competitive moat
Our AI-assisted moat analysis scores the competitive advantage at 9 out of 100 (medium confidence).
What moves the price
The share trades about 55% below its 52-week high and 73% above its 52-week low, currently below its 200-day average.
For context, the median of 10 Technology peers we cover trades at 13% fair-value upside, at −41%, RIWI screens richer than that median.
Fair Value
Quality Score breakdown
It rates the business: profits, how they develop, real cash, balance sheet, investing and share count.
Revenue & earnings trend
RIWI screens overvalued: fair value 41% below the price. Compare with SAP SE →
Compare Riwi Corp with another stock
Price, fair value, quality and upside side by side.
Peer GroupⓘHow this stock ranks against its industry: the green marker is this stock, the band is the typical 25–75% peer range, and the tick is the median.Software - Application · 723 stocks
Valuation Multiplesvs Software - Application median · lower = cheaper
Context: sector, industry, market
- Is the Information Technology sector expensive or cheap?
- P/E, EV/EBITDA and margins by industry (reference tables)
- EBIT margin by industry
- P/S ratio by industry
- Stock screener with 62 metrics
- Undervalued stocks: Canadian Stocks
- Valuation of the Canada market
Values & ESG
Does this company touch areas you may want to avoid? The classification is inferred from sector and industry.
Similar stocks
10 more Software - Application stocks, each showing price versus our Fair Value estimate.
| Stock | Price | Fair Value | vs Fair Value | Compare |
|---|---|---|---|---|
| Adobe Inc ADBE | $236.70 | $463.72 | +96% | vs RIWI |
| Salesforce, Inc CRM | $213.48 | $342.73 | +61% | vs RIWI |
| Uber Technologies, Inc UBER | $70.05 | $101.28 | +45% | vs RIWI |
| Intuit Inc INTU | $340.44 | $459.14 | +35% | vs RIWI |
| ServiceNow, Inc NOW | $99.61 | $112.17 | +13% | vs RIWI |
| SAP SE SAP | €209.95 | €173.59 | −17% | vs RIWI |
| Cadence Design Systems, Inc CDNS | $331.64 | $225.48 | −32% | vs RIWI |
| Automatic Data Processing, Inc ADP | $305.44 | $150.40 | −51% | vs RIWI |
| Shopify Inc SHOP | $146.61 | $64.96 | −56% | vs RIWI |
| Snowflake Inc SNOW | $295.76 | $73.81 | −75% | vs RIWI |
Explore undervalued stocks
More undervalued Technology stocks →
Try a ready-made strategy
Pick a strategy and jump into the live analysis with that exact screen applied.
Discover tools
For bloggers & editors: embed code + live data
For bloggers, editors and developers: paste this into your site or blog (a “Custom HTML” block in WordPress), it shows the current fair value and links back here. Free, plain HTML, and welcome. Full data streams (CSV/JSON) at /developers.
Cite: Fair Value Calculator (2026). "Riwi Corp Fair Value". https://www.fairvalue-calculator.com/stock/RIWI
Frequently asked questions
Is Riwi Corp (RIWI) overvalued or undervalued?
What is the fair value of RIWI?
What is the quality score of RIWI?
What is the price target for Riwi Corp (RIWI)?
What is the Riwi Corp stock forecast for 2026?
What is the revenue of Riwi Corp (RIWI)?
What is the intrinsic value of Riwi Corp (RIWI)?
Is Riwi Corp stock overvalued or undervalued in 2026?
Is fair value the same as the market price of RIWI?
How much is Riwi Corp worth?
What do the bullish and bearish scenarios say about RIWI?
How solid is the balance sheet of Riwi Corp (RIWI)?
How far is RIWI from its 52-week high?
Which stocks are comparable to Riwi Corp?
Is Riwi Corp stock attractive at the current price?
Is it still worth investing in stocks now?
What is the share price of Riwi Corp (RIWI)?
What should I pay attention to with Riwi Corp right now?
Key figures of Riwi Corp
How large is the market capitalisation of Riwi Corp (RIWI)?
What is the P/S ratio of Riwi Corp (RIWI)?
What are the earnings per share of Riwi Corp (RIWI)?
What is the net margin of Riwi Corp (RIWI)?
What is the return on equity of Riwi Corp (RIWI)?
What is the EBIT return on assets of Riwi Corp (RIWI)?
What is the operating margin of Riwi Corp (RIWI)?
How fast is revenue growing at Riwi Corp (RIWI)?
How fast are earnings growing at Riwi Corp (RIWI)?
How much free cash flow does Riwi Corp (RIWI) generate?
Watch Riwi Corp in the live analysis
One click puts Riwi Corp on your watchlist: fair value and trend at a glance, plus comparison, the diversification check and the 27,000+ stock screener.
Watch for free →Zero risk: nothing is ever charged. Your watchlist is yours, with or without an account.