Intrinsic stock value calculators provide investors with powerful tools for determining what a company is genuinely worth based on its fundamental business characteristics rather than relying solely on market sentiment or price momentum. These calculators employ rigorous valuation methodologies that analyze cash flows, earnings, growth rates, and risk factors to estimate a stock’s true value independent of its current market price. By comparing calculated intrinsic value to market price, investors can identify potentially undervalued opportunities offering significant upside potential or avoid overpriced stocks likely to deliver disappointing returns.
Understanding how to properly use intrinsic value calculators separates disciplined value investors from those who chase trends or make decisions based on incomplete analysis. These tools democratize sophisticated valuation techniques previously available only to professional analysts with advanced financial modeling skills, enabling individual investors to make more informed decisions grounded in fundamental business analysis rather than speculation or emotion.
Understanding Intrinsic Value and Why It Matters
Intrinsic value represents the theoretical true worth of a company based on its ability to generate cash flows and profits for shareholders over time. Unlike market price, which fluctuates based on supply and demand dynamics, investor sentiment, and short-term news, intrinsic value remains anchored to fundamental business performance and long-term earning power. This distinction proves crucial because markets regularly misprice securities, creating opportunities for investors who can accurately assess intrinsic value and act when significant gaps emerge.
The concept traces back to value investing pioneers Benjamin Graham and David Dodd, who argued that intelligent investors should focus on business fundamentals rather than market psychology. Warren Buffett refined these principles, defining intrinsic value as the discounted present value of all future cash flows a business will generate. When market price falls below intrinsic value, a margin of safety exists that protects investors from adverse developments while offering appreciation potential as the market eventually recognizes true worth.
Explore our most popular stock fair value calculators to find opportunities where the market price is lower than the true value.
- Peter Lynch Fair Value – Combines growth with valuation using the PEG ratio. A favorite among growth investors.
- Buffett Intrinsic Value Calculator – Based on Warren Buffett’s long-term DCF approach to determine business value.
- Buffett Fair Value Model – Simplified version of his logic with margin of safety baked in.
- Graham & Dodd Fair Value – Uses conservative earnings-based valuation from classic value investing theory.
- Intrinsic vs. Extrinsic Value – Learn the core difference between what a company’s really worth and what others pay.
- Intrinsic Value Calculator – A general tool to estimate the true value of a stock, based on earnings potential.
- Fama-French Model – For advanced users: Quantifies expected return using size, value and market risk.
- Discount Rate Calculator – Helps estimate the proper rate to use in any DCF-based valuation model.
Intrinsic value calculations require making assumptions about future business performance, growth trajectories, and appropriate discount rates reflecting investment risk. Different investors analyzing the same company may arrive at different intrinsic values based on varying assumptions about these factors, making the process part art and part science. However, systematic application of consistent valuation frameworks helps investors develop conviction in their analyses and maintain discipline during periods when market prices diverge significantly from their calculated values.
Key Valuation Models in Intrinsic Value Calculators
The discounted cash flow model represents the most theoretically sound approach to calculating intrinsic value, as it directly measures a company’s ability to generate cash for shareholders. This method projects future free cash flows over a specific period, typically five to ten years, then calculates a terminal value representing all cash flows beyond the projection period. Each future cash flow gets discounted back to present value using a discount rate that reflects the investment’s riskiness, with higher-risk companies requiring higher discount rates that reduce present values.
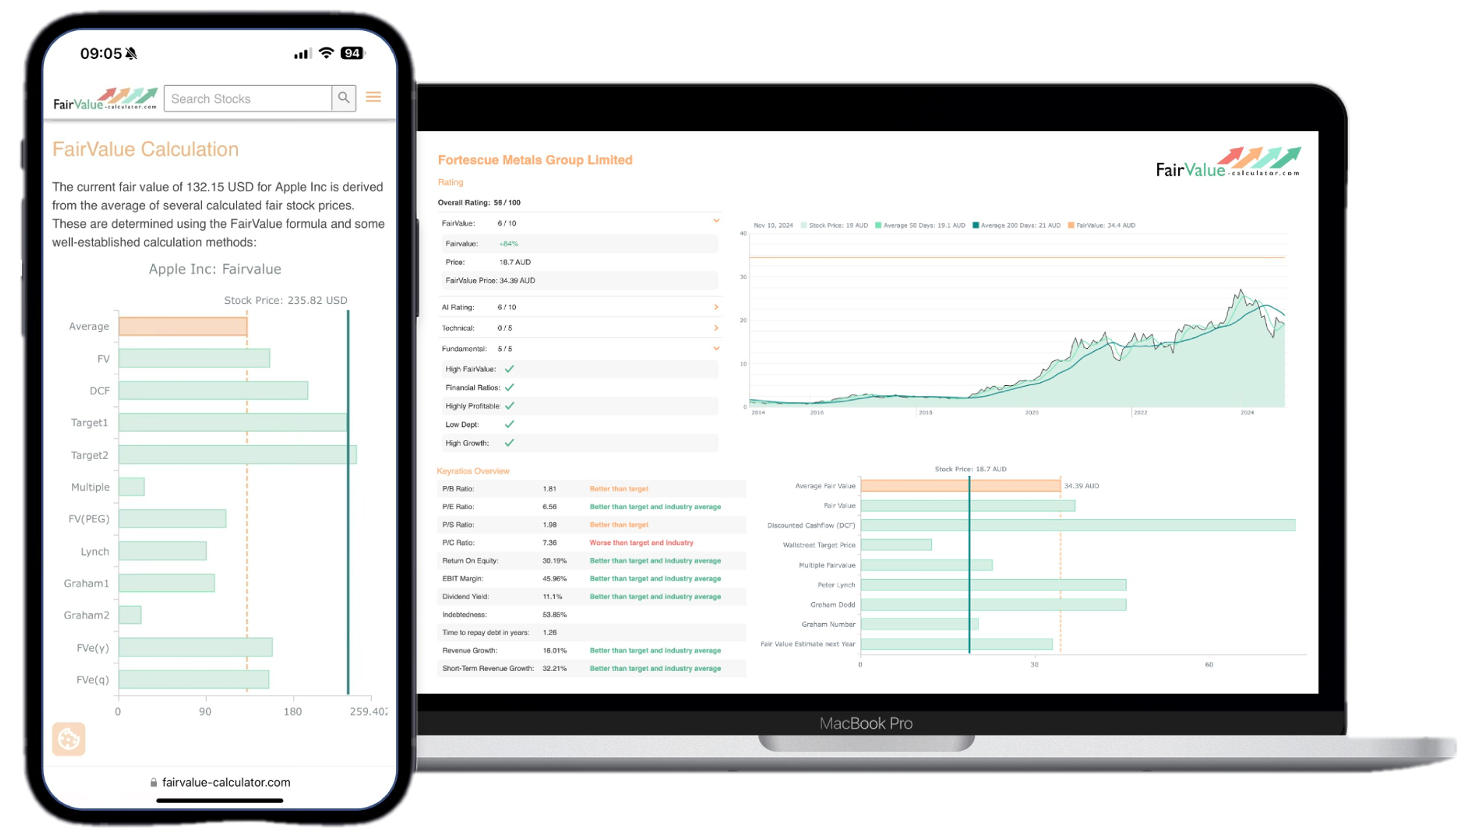
💡 Discover Powerful Investing Tools
Stop guessing – start investing with confidence. Our Fair Value Stock Calculators help you uncover hidden value in stocks using time-tested methods like Discounted Cash Flow (DCF), Benjamin Graham’s valuation principles, Peter Lynch’s PEG ratio, and our own AI-powered Super Fair Value formula. Designed for clarity, speed, and precision, these tools turn complex valuation models into simple, actionable insights – even for beginners.
Learn More About the Tools →Using a DCF calculator requires inputting current free cash flow, expected growth rates during the projection period, a terminal growth rate for the perpetuity period, and an appropriate discount rate often based on the weighted average cost of capital. The calculator then computes the sum of all discounted future cash flows to arrive at total enterprise value, from which net debt is subtracted to determine equity value. Dividing equity value by shares outstanding produces intrinsic value per share that can be directly compared to the current stock price.
Dividend discount models offer an alternative approach particularly suited for mature companies with established dividend payment histories. These calculators use current dividends, expected dividend growth rates, and required rates of return to calculate present values of all future dividend payments. The Gordon Growth Model, a simplified version assuming constant perpetual dividend growth, calculates intrinsic value as next year’s expected dividend divided by the difference between the required return and growth rate. While elegant in simplicity, this model proves most reliable for stable dividend-paying companies rather than high-growth firms that retain earnings for reinvestment.

Earnings-based calculators employ various multiples and ratios to estimate intrinsic value from current or projected earnings. The most straightforward approach multiplies normalized earnings per share by a justified price-to-earnings ratio based on growth prospects, profitability, and industry comparables. More sophisticated earnings-based models like the PEG ratio incorporate growth rates directly, dividing the P/E ratio by the expected earnings growth rate to identify companies trading at attractive valuations relative to their growth potential. These methods work well for profitable companies with predictable earnings but struggle with cyclical businesses or those in early growth stages.
Asset-based valuation calculators focus on book value and tangible assets, calculating intrinsic value from balance sheet metrics rather than income statement performance. This approach particularly suits financial institutions, real estate companies, and firms holding substantial hard assets. Calculators might use book value directly, apply price-to-book ratios adjusted for return on equity and growth, or calculate liquidation values representing what shareholders would receive if the company sold all assets and paid all liabilities. While less applicable to service businesses or companies whose value derives from intangibles, asset-based methods provide useful sanity checks and floor estimates for intrinsic value.
Gathering the Required Input Data
Accurate intrinsic value calculations depend entirely on the quality of input data, making thorough research essential before using any calculator. Financial statements provide the foundation, with income statements supplying earnings and revenue data, balance sheets offering asset and liability information, and cash flow statements revealing actual cash generation capability. Public companies file these statements quarterly and annually with regulatory authorities, making them freely accessible through company investor relations websites or financial data aggregators.
Free cash flow, perhaps the most critical input for DCF models, requires calculation from financial statement data rather than direct observation. The standard approach starts with operating cash flow from the cash flow statement, then subtracts capital expenditures needed to maintain and grow the business. Some analysts make additional adjustments for working capital changes, one-time items, or stock-based compensation to arrive at a normalized free cash flow figure that better represents sustainable generation capability.
Growth rate assumptions profoundly impact calculated intrinsic values, as companies expected to grow rapidly justify higher valuations than those facing stagnant or declining prospects. Historical growth rates provide starting points, calculated from revenue, earnings, or free cash flow trends over recent years. However, past growth doesn’t guarantee future performance, requiring consideration of industry dynamics, competitive positioning, market opportunity size, and management quality when projecting forward. Conservative investors often use multiple scenarios with different growth assumptions to understand sensitivity and avoid overoptimistic projections.
Discount rate selection requires determining an appropriate required return reflecting the investment’s risk level. The capital asset pricing model provides one framework, calculating required return as the risk-free rate plus beta multiplied by the market risk premium. Risk-free rates typically come from government bond yields, while beta measures a stock’s volatility relative to the overall market. Some calculators simplify this by allowing investors to input desired return hurdles directly, such as 10% or 12%, representing the minimum return they require to justify investment given perceived risks.
Step-by-Step Process for Using DCF Calculators
Begin by locating the company’s most recent annual and quarterly financial statements to extract current free cash flow figures. Calculate free cash flow by taking operating cash flow and subtracting capital expenditures, making adjustments for unusual items that distort the underlying business performance. If using a multi-year average to smooth volatility, weight recent years more heavily than distant historical periods that may not reflect current business economics.
Input your base-year free cash flow into the calculator along with growth rate assumptions for the explicit projection period. Consider using higher growth rates for early years if the company is in expansion mode, then gradually declining to more sustainable rates as the projection period progresses. Many calculators allow year-by-year growth inputs rather than assuming constant growth throughout, enabling more nuanced projections that reflect expected business evolution.
Determine an appropriate terminal growth rate representing perpetual growth beyond your projection period. This rate should not exceed the long-term economic growth rate, as no company can sustainably grow faster than the economy forever. Conservative estimates often use GDP growth rates of two to three percent, though companies in declining industries might warrant lower terminal rates or even negative growth assumptions.
Select a discount rate reflecting your required return and the investment’s risk profile. Higher discount rates penalize future cash flows more heavily, producing lower intrinsic values and creating higher hurdles for investment consideration. Technology companies, startups, or businesses with uncertain futures typically require higher discount rates of 12% to 15% or more, while stable consumer staples or utilities might use rates closer to 8% to 10%. Input this rate into the calculator, which will then discount all projected cash flows and terminal value back to present value.
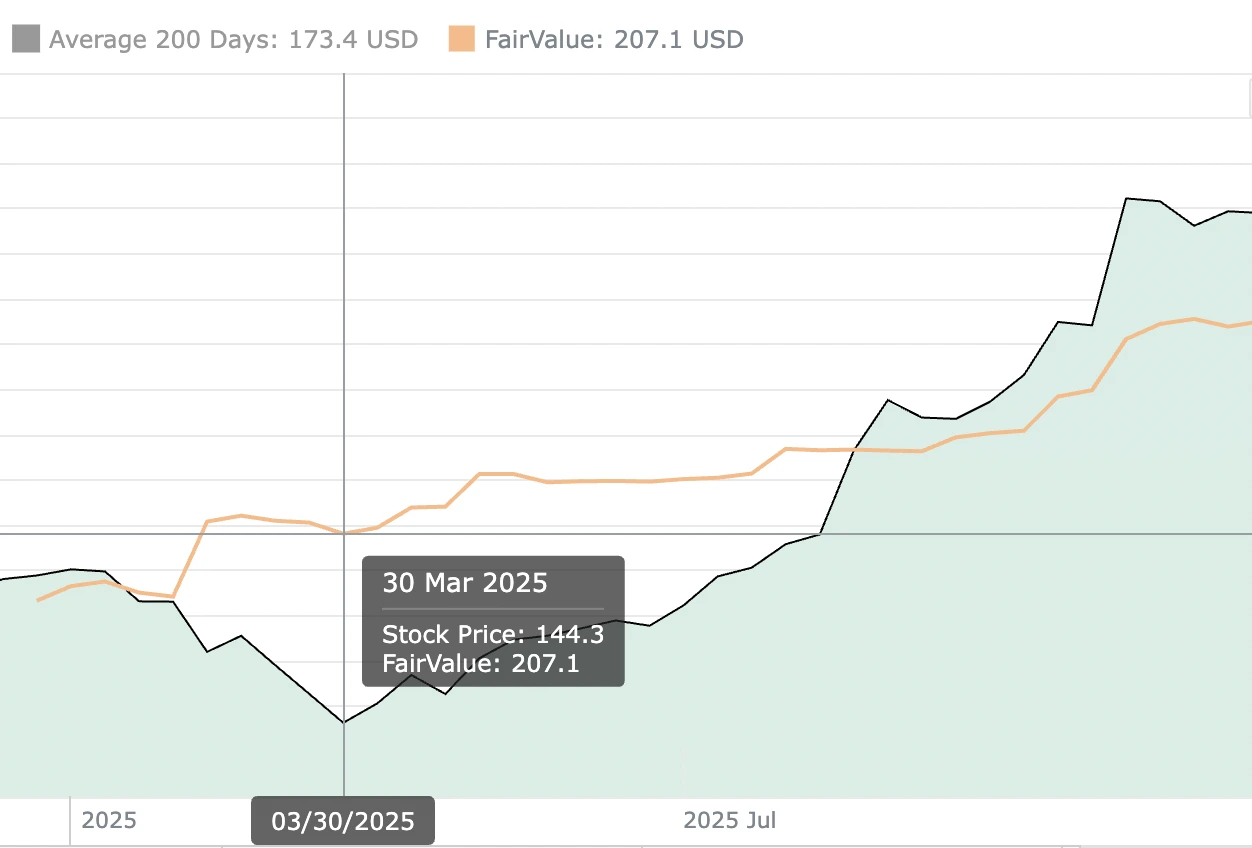
Review the calculated intrinsic value per share produced by the calculator and compare it to the current market price. A significant gap with intrinsic value substantially above market price suggests potential undervaluation warranting further investigation. Calculate the margin of safety by determining what percentage the market price sits below your intrinsic value estimate, with larger margins providing greater protection against analytical errors or adverse developments.
Interpreting Results and Making Investment Decisions
When intrinsic value exceeds market price by 20% to 30% or more, it suggests a meaningful margin of safety that may justify investment consideration. However, the existence of a gap alone doesn’t automatically signal a buying opportunity, as the market may have information or perspectives not reflected in your analysis. Investigate why the discrepancy exists by researching recent news, analyst reports, and industry trends that might explain the market’s skepticism.
Conversely, when market price substantially exceeds your calculated intrinsic value, exercise caution before investing regardless of the company’s popularity or recent price momentum. Overvalued stocks eventually face corrections as growth disappoints, multiples compress, or investors rotate toward more attractive opportunities. Even excellent companies represent poor investments when purchased at excessive prices that leave no room for error and guarantee mediocre or negative returns.
Some situations produce intrinsic values very close to market prices, suggesting fair valuation where the stock is neither compelling nor obviously overpriced. These neutral results might support holding existing positions but typically don’t warrant new investment unless other qualitative factors provide additional conviction. Patient investors often maintain watchlists of fairly valued, quality companies, waiting for market volatility or temporary setbacks to create more attractive entry points with better margins of safety.
Sensitivity analysis helps understand how changes in key assumptions affect calculated intrinsic value and investment conclusions. Run the calculator using optimistic, base case, and pessimistic scenarios for growth rates and discount rates to see the range of possible intrinsic values. If even pessimistic scenarios produce intrinsic values above market price, you gain confidence that the investment opportunity remains attractive despite uncertainty. Conversely, if only highly optimistic assumptions justify current prices, recognize the speculative nature of the investment and elevated risk of disappointment.
Common Mistakes When Using Intrinsic Value Calculators
Overoptimistic growth projections represent the most frequent error, as investors naturally gravitate toward exciting growth stories and underweight risks that might derail ambitious trajectories. Companies regularly fail to achieve projected growth due to competition, market saturation, execution challenges, or changing consumer preferences. Counterbalance optimism by researching how often companies in similar situations actually achieved projected growth rates and considering what could go wrong rather than only imagining best-case scenarios.
Using overly low discount rates produces inflated intrinsic values that suggest bargains where none exist. Some investors mistakenly use current bond yields or savings account rates as discount rates, ignoring the substantially higher risk of equity ownership. Appropriate discount rates should exceed historical stock market returns of approximately 10% for average-risk companies, with adjustments upward for riskier situations and potentially downward for exceptional businesses with durable competitive advantages and predictable cash flows.
Failing to adjust for debt, cash, and other balance sheet items can significantly distort per-share intrinsic value calculations. DCF models typically calculate enterprise value, representing the entire business, requiring subtraction of net debt and addition of excess cash to arrive at equity value before dividing by shares outstanding. Ignoring these adjustments can make heavily indebted companies appear cheaper than they actually are or cause cash-rich businesses to seem more expensive than their operating values justify.
Anchoring too heavily to a single intrinsic value estimate without considering ranges or alternative scenarios creates false precision and potentially dangerous overconfidence. Market uncertainty, estimation errors, and changing business conditions mean any intrinsic value calculation represents a best estimate within a range of possibilities rather than an exact figure. Prudent investors acknowledge this uncertainty by considering multiple valuation approaches, running sensitivity analyses, and requiring larger margins of safety when facing greater uncertainty.
Enhancing Calculator Results with Qualitative Analysis
While intrinsic value calculators provide quantitative estimates, combining numerical analysis with qualitative business assessment produces superior investment decisions. Evaluate management quality by researching track records, capital allocation decisions, and whether executives’ interests align with shareholders through meaningful ownership stakes. Superior management teams create value over time even when facing challenges, while poor leadership destroys value despite favorable industry conditions.
Competitive positioning and economic moats significantly influence whether companies can sustain growth and profitability assumptions used in intrinsic value calculations. Companies with durable competitive advantages from brand strength, network effects, cost advantages, or regulatory barriers can maintain high returns on capital and defend against competition more effectively than those operating in commoditized industries. Strong moats justify more aggressive growth assumptions and potentially lower discount rates, reflecting reduced business risk.
Industry dynamics and secular trends provide crucial context for interpreting calculator results and validating assumptions. Companies operating in growing industries with favorable tailwinds can achieve ambitious targets more readily than those fighting structural headwinds. Research whether the industry is expanding, consolidating, or disrupting, and how technological, demographic, or regulatory changes might impact future prospects. Even precisely calculated intrinsic values become meaningless if based on assumptions that fail to account for transformative industry shifts.
Financial health and balance sheet strength deserve scrutiny beyond what flows directly into most intrinsic value calculators. Examine debt levels relative to cash flow generation, debt maturity schedules, interest coverage ratios, and access to credit markets. Highly leveraged companies face refinancing risks and financial distress scenarios that may not surface in base-case valuation models but could dramatically impair equity value if cash flows disappoint or credit conditions tighten.
Comparing Multiple Valuation Approaches
Using several different intrinsic value calculation methods provides more robust conclusions than relying on any single approach. Run both DCF and earnings-based models, then compare results to see if they converge on similar value ranges or produce divergent estimates requiring explanation. When multiple methodologies suggest similar intrinsic values, confidence in the analysis increases, while significant divergences signal the need for more profound investigation into which assumptions or approaches best fit the specific company situation.
Relative valuation using peer comparisons complements absolute intrinsic value calculations by showing whether a company trades at premiums or discounts relative to similar businesses. Compare price-to-earnings, price-to-sales, price-to-book, and enterprise value-to-EBITDA ratios to industry peers and historical ranges for the company itself. If absolute intrinsic value calculations suggest undervaluation but relative metrics show the company trading at significant premiums to peers, investigate what justifies the differential or whether your intrinsic value assumptions may be too optimistic.
Sum-of-the-parts analysis proves valuable for diversified companies operating multiple distinct businesses that might deserve different valuation multiples or growth assumptions. Calculate separate intrinsic values for each major business segment using approaches appropriate to their individual characteristics, then aggregate to determine total company value. This granular approach often reveals hidden value in underappreciated divisions or highlights how one underperforming segment drags down overall valuation.
Scenario analysis takes intrinsic value calculations further by modeling distinctly different future paths rather than simply adjusting growth rate assumptions within a single framework. Develop best-case scenarios assuming favorable resolution of key uncertainties, base cases reflecting most likely outcomes, and worst-case scenarios incorporating realistic negative developments. Assign probability weights to each scenario, then calculate probability-weighted intrinsic value, providing more nuanced estimates than single-point forecasts.
Maintaining and Updating Your Valuations
Intrinsic value calculations require regular updates as new financial information becomes available and business conditions evolve. Review and refresh your assumptions quarterly when companies report earnings, incorporating new data about revenue growth, margin trends, cash flow generation, and management guidance. Even when maintaining positions in companies, updated valuations help determine whether to add to holdings, trim positions, or maintain current allocations based on changing value relative to price.
Significant business developments between quarterly reports may warrant immediate valuation reassessment. Major acquisitions, divestitures, product launches, competitive threats, regulatory changes, or management transitions all potentially impact assumptions underlying intrinsic value calculations. Develop frameworks for quickly evaluating whether new information materially affects your thesis, warranting full model updates, or represents noise that doesn’t fundamentally alter long-term value.
Track the accuracy of your historical intrinsic value estimates by comparing calculated values to subsequent business performance and stock price movements. This retrospective analysis helps identify systematic biases in your assumptions, such as consistently overestimating growth rates or using inappropriate discount rates. Learning from past estimation errors improves future analytical accuracy and helps calibrate appropriate margins of safety based on your track record.
Document your intrinsic value calculations and supporting assumptions so you can revisit the reasoning behind past valuations. Written investment theses explaining why particular growth rates, terminal values, or discount rates seemed appropriate given available information at the time provide valuable learning opportunities. Reviewing these documented analyses helps distinguish between valid analytical approaches that simply faced unfortunate outcomes and flawed reasoning that deserves correction in future valuations.
FAQs
What is the difference between intrinsic value and market price?
Intrinsic value represents the theoretical true worth of a company based on its fundamental ability to generate cash flows and profits over time, calculated using rigorous valuation models that analyze business economics. Market price reflects what investors currently pay based on supply and demand dynamics, sentiment, and short-term factors that may or may not align with fundamental value. The gap between these figures creates investment opportunities, with significant discounts of market price below intrinsic value suggesting potential bargains, while substantial premiums indicate possible overvaluation requiring caution.
Which intrinsic value calculation method should I use?
The most appropriate method depends on the company’s characteristics and your available information. Discounted cash flow models work well for profitable companies with predictable cash flows and reasonable growth visibility, while dividend discount models suit mature businesses with established payout histories. Earnings-based approaches help when cash flow data is limited or for comparing similar companies, and asset-based methods work for financial institutions or companies holding substantial tangible assets. Most thorough analyses employ multiple methods to see if different approaches converge on similar values, increasing confidence in conclusions.
How accurate are intrinsic value calculators?
Intrinsic value calculators provide mathematically precise results based on the assumptions you input, but those assumptions about future growth, profitability, and appropriate discount rates inherently involve uncertainty. Short-term calculations for stable businesses generally prove more accurate than long-term projections for volatile growth companies, where small assumption changes dramatically impact results. View calculated values as reasonable estimates within ranges rather than exact figures, and use multiple scenarios to understand sensitivity. Over time, tracking your historical accuracy helps calibrate how much margin of safety to require before investing.
What margin of safety should I require before investing?
Conservative value investors typically seek margins of safety of 20% to 30% or more, meaning market price should sit well below calculated intrinsic value before investment. Larger margins provide greater protection against analytical errors, adverse business developments, or market volatility that might impair results. Highly uncertain situations with wide valuation ranges, cyclical businesses, or companies facing significant challenges warrant larger margins of 40% to 50%, while exceptional businesses with predictable economics might justify smaller margins of 15% to 20%. Your personal risk tolerance and confidence in your analysis should guide specific margin requirements.
How often should I recalculate intrinsic value?
Quarterly recalculation when companies report earnings ensures your valuations incorporate the latest financial performance and updated guidance. Between quarterly reports, significant business developments like major acquisitions, competitive threats, or industry changes may warrant immediate reassessment if they materially impact your assumptions. For companies you monitor without owning, annual or semi-annual updates often suffice unless dramatic changes occur. Regular updates help determine whether to maintain, increase, or reduce positions as the relationship between intrinsic value and market price evolves over time.
Can intrinsic value calculators work for growth stocks with no earnings?
Traditional earnings-based and dividend discount models struggle with unprofitable growth companies, but discounted cash flow approaches can still apply by projecting when profitability will emerge and modeling future cash flows from that point forward. These projections involve greater uncertainty, requiring more conservative assumptions and larger margins of safety. Some investors prefer waiting until growth companies demonstrate sustainable profitability before attempting valuation, while others comfortable with higher uncertainty use revenue multiples from comparable companies or venture capital-style approaches considering total addressable markets and potential market share.
Should I trust intrinsic value over market price when making decisions?
Neither intrinsic value calculations nor market prices deserve blind trust, as both involve limitations and can be wrong. Intrinsic value depends entirely on your assumptions, which may prove overly optimistic or pessimistic regardless of analytical rigor. Market prices aggregate countless investors’ views but regularly overshoot in both directions, driven by sentiment rather than fundamentals. The wisest approach uses intrinsic value as one important input informing decisions, while respecting that wide gaps between calculated value and market price often exist for legitimate reasons requiring investigation before assuming the market is simply wrong.
How do I account for uncertainty in my intrinsic value calculations?
Address uncertainty through several complementary approaches rather than trying to eliminate it entirely. Run sensitivity analyses varying key assumptions like growth rates and discount rates to understand how changes impact calculated values and whether investment theses hold across reasonable ranges. Develop multiple scenarios modeling distinctly different future paths with probability weights, producing probability-weighted intrinsic values. Require larger margins of safety when facing greater uncertainty, ensuring even if your analysis proves somewhat optimistic, adequate protection exists. Most importantly, acknowledge uncertainty honestly in your reasoning rather than creating false precision through overly confident point estimates.