Johnson & Johnson stands as one of the most enduring and diversified healthcare companies in the world, with a business portfolio spanning pharmaceuticals, medical devices, and consumer health products that has generated consistent returns for shareholders across multiple generations. Understanding the intrinsic value of this healthcare giant requires careful analysis of its multiple business segments, robust cash flow generation, substantial research and development pipeline, and competitive positioning within the global healthcare industry. Investors seeking exposure to defensive healthcare stocks with stable dividends and long-term growth potential regularly analyze Johnson & Johnson’s intrinsic value to determine whether current market prices offer attractive entry points or suggest overvaluation requiring patience.
The company’s transformation over recent years, including the spinoff of its consumer health division into Kenvue and increased focus on higher-margin pharmaceutical and medical technology businesses, fundamentally altered its growth profile and valuation characteristics. These strategic shifts, combined with ongoing legal and regulatory challenges, create a complex valuation picture that rewards thorough fundamental analysis over superficial assessments based solely on historical metrics or brand recognition.
Understanding Johnson & Johnson’s Business Model
Johnson & Johnson operates through two primary segments following the Kenvue separation: Innovative Medicine (pharmaceuticals) and MedTech (medical devices and equipment). The pharmaceutical segment generates the majority of revenue and profit, with blockbuster drugs across immunology, oncology, cardiovascular, and neuroscience therapeutic areas. Key products include Stelara for autoimmune diseases, Darzalex for multiple myeloma, and Tremfya for psoriasis, among numerous other therapies addressing significant unmet medical needs across diverse patient populations.
The MedTech segment provides surgical equipment, orthopedic devices, vision care products, and interventional solutions used in hospitals and clinical settings worldwide. This business benefits from aging demographics driving increased surgical procedures, technological advancement enabling minimally invasive techniques, and recurring revenue from consumable products that accompany durable equipment sales. While growing more slowly than pharmaceuticals, MedTech operations provide diversification and stable cash flows that reduce overall business volatility.
Explore our most popular stock fair value calculators to find opportunities where the market price is lower than the true value.
- Peter Lynch Fair Value – Combines growth with valuation using the PEG ratio. A favorite among growth investors.
- Buffett Intrinsic Value Calculator – Based on Warren Buffett’s long-term DCF approach to determine business value.
- Buffett Fair Value Model – Simplified version of his logic with margin of safety baked in.
- Graham & Dodd Fair Value – Uses conservative earnings-based valuation from classic value investing theory.
- Intrinsic vs. Extrinsic Value – Learn the core difference between what a company’s really worth and what others pay.
- Intrinsic Value Calculator – A general tool to estimate the true value of a stock, based on earnings potential.
- Fama-French Model – For advanced users: Quantifies expected return using size, value and market risk.
- Discount Rate Calculator – Helps estimate the proper rate to use in any DCF-based valuation model.
Johnson & Johnson’s competitive advantages derive from multiple sources that support premium valuations and justify optimistic growth assumptions in intrinsic value calculations. The company maintains one of the industry’s largest research and development budgets, funding extensive clinical trial programs that continuously replenish its product pipeline as older drugs face patent expirations and generic competition. Strong relationships with healthcare providers, regulatory expertise accumulated over decades, global manufacturing and distribution capabilities, and the financial resources to acquire promising development-stage therapies from smaller biotechnology companies all contribute to sustainable competitive positioning.
The business model generates substantial free cash flow that funds dividend payments, share repurchases, acquisitions, and research investments without requiring significant external financing. This cash generation capability stems from high profit margins on patented pharmaceuticals, relatively low capital intensity compared to manufacturing-heavy industries, and efficient working capital management. Understanding these cash flow characteristics proves essential for discounted cash flow valuations that form the foundation of rigorous intrinsic value analysis.
💡 Discover Powerful Investing Tools
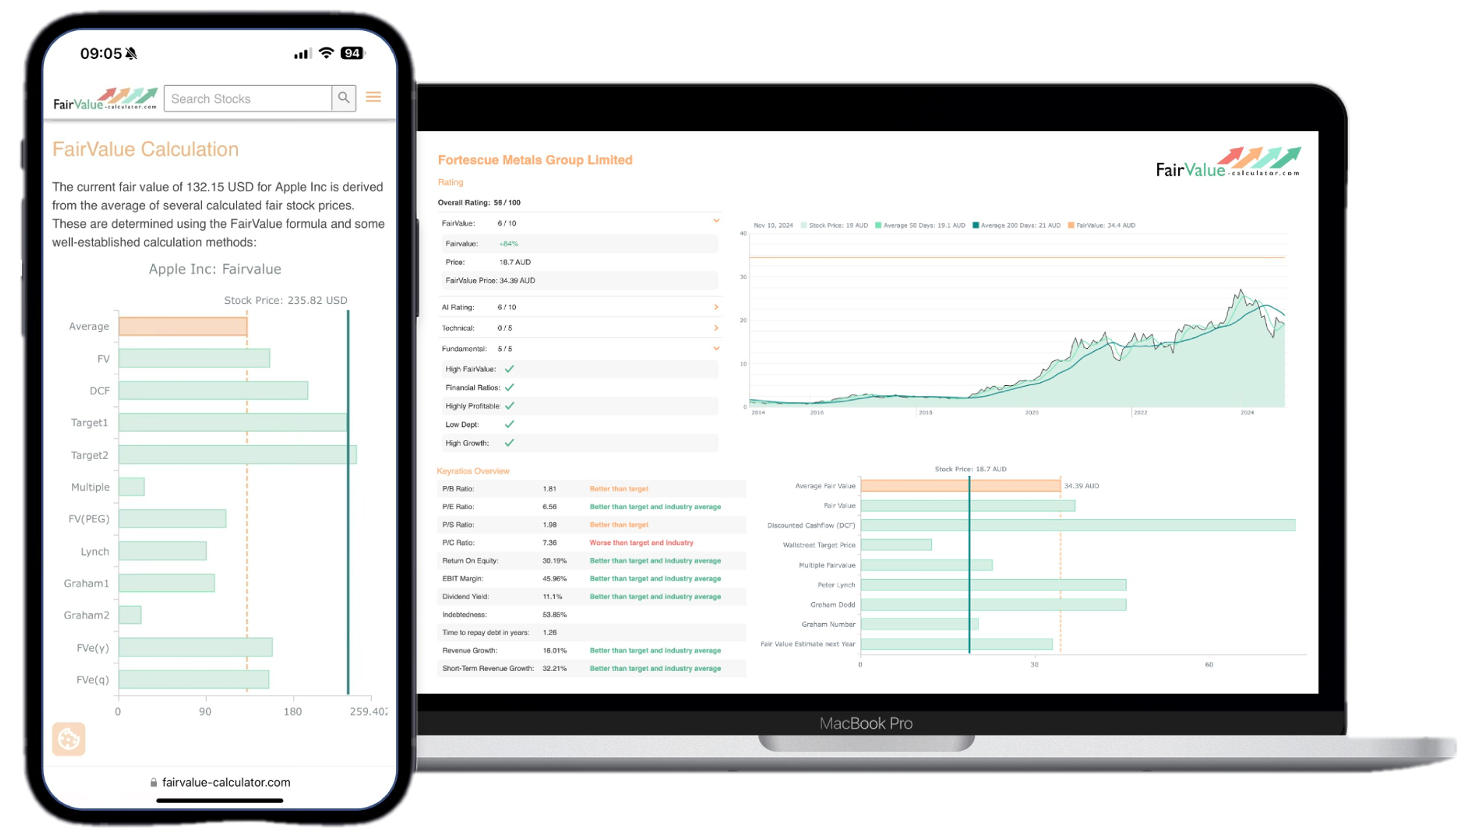
Stop guessing – start investing with confidence. Our Fair Value Stock Calculators help you uncover hidden value in stocks using time-tested methods like Discounted Cash Flow (DCF), Benjamin Graham’s valuation principles, Peter Lynch’s PEG ratio, and our own AI-powered Super Fair Value formula. Designed for clarity, speed, and precision, these tools turn complex valuation models into simple, actionable insights – even for beginners.
Learn More About the Tools →Key Financial Metrics and Historical Performance
Johnson & Johnson has demonstrated remarkable consistency in revenue and earnings growth over multi-decade periods, though recent years have seen more volatility due to patent expirations on major products, the COVID-19 pandemic’s impact on elective procedures, and legal settlements related to talc litigation and opioid-related claims. Analyzing normalized earnings that adjust for one-time charges and extraordinary items provides clearer pictures of underlying business performance than reported figures that include significant non-recurring impacts.
Free cash flow generation typically exceeds reported earnings due to favorable non-cash charges and working capital dynamics, making cash flow-based valuations potentially more relevant than earnings multiples for this company. Over the past decade, Johnson & Johnson has converted roughly 80% to 90% of net income into free cash flow, demonstrating efficient capital deployment and minimal reinvestment requirements to maintain competitive positioning. This high conversion rate supports substantial shareholder distributions while maintaining robust balance sheet strength.

The company’s dividend history stands among the most impressive in corporate America, with 61 consecutive years of dividend increases earning it Dividend King status. Current dividend yields typically range from 2.5% to 3.5% depending on stock price fluctuations, providing meaningful income while indicating management confidence in future cash flow generation. Dividend growth rates averaging 5% to 6% annually demonstrate commitment to returning value to shareholders while maintaining flexibility for strategic investments and acquisitions.
Return on invested capital and return on equity metrics reveal how efficiently Johnson & Johnson deploys shareholder capital to generate profits. ROIC typically exceeds 15%, well above the company’s cost of capital, indicating value creation rather than destruction. These profitability metrics justify premium valuations relative to companies that generate lower returns, as high-ROIC businesses compound shareholder wealth more effectively over time and deserve higher price-to-earnings and price-to-book multiples.
Applying Discounted Cash Flow Valuation
Calculating Johnson & Johnson’s intrinsic value using discounted cash flow methodology begins with establishing a normalized baseline free cash flow figure. Recent annual free cash flow has ranged from $15 billion to $20 billion depending on working capital fluctuations, one-time legal settlements, and business performance. Using the most recent full-year figure or a multi-year average smooths temporary volatility and provides reasonable starting points for projection.
Growth rate assumptions must account for multiple offsetting factors that will shape future cash flow generation. Patent expirations on major pharmaceutical products create headwinds as generic competition erodes revenues and margins, while new drug approvals and market share gains for recently launched therapies provide growth drivers. The medical device business grows more steadily at mid-single-digit rates reflecting healthcare utilization trends and market expansion. Blending these dynamics suggests consolidated growth rates of 4% to 6% for intermediate projection periods might represent reasonable base-case assumptions, though bears and bulls would adjust these figures based on their pipeline optimism and competitive concerns.
Terminal growth rates for the perpetuity period beyond explicit projections should reflect long-term healthcare market expansion, likely ranging from 2% to 4%. The lower end assumes Johnson & Johnson grows roughly in line with GDP as the business matures and competition intensifies, while higher estimates credit the company’s innovation capabilities and positioning in expanding markets. Conservative valuations typically use terminal rates at or below 3% to avoid unrealistic assumptions about indefinite above-market growth that no company can sustain forever.
Discount rate selection requires determining appropriate compensation for the risks inherent in Johnson & Johnson’s equity. The company’s beta typically hovers around 0.7, indicating lower volatility than the overall market and reflecting healthcare’s defensive characteristics. Using the capital asset pricing model with current risk-free rates around 4% to 5%, market risk premiums of 5% to 6%, and adjusting for company-specific factors, appropriate discount rates likely fall in the 8% to 10% range. Higher discount rates produce more conservative valuations with larger margins of safety, while rates toward the lower end recognize the business quality and stability relative to typical equity investments.
Assembling these components into a complete DCF model, a baseline scenario might project $18 billion current free cash flow growing at 5% for ten years, then 3% perpetually, discounted at 9%. This produces enterprise value that, after adjusting for net debt and dividing by shares outstanding, yields intrinsic value per share estimates. Sensitivity analysis varying growth and discount assumptions by reasonable ranges reveals whether calculated values remain attractive across multiple scenarios or depend heavily on optimistic assumptions.
Earnings-Based Valuation Approaches
Price-to-earnings multiples provide simpler valuation frameworks that, while less theoretically rigorous than DCF analysis, offer useful perspectives and comparison points. Johnson & Johnson’s forward P/E ratio has historically traded in a range of 14 to 18 times next year’s expected earnings, with variations based on interest rate environments, market sentiment toward healthcare stocks, and company-specific developments. Comparing current multiples to historical ranges and peer group averages helps identify whether the stock trades at premiums or discounts to typical valuations.
Justified P/E ratios can be calculated based on growth rates, payout ratios, and required returns using dividend discount model frameworks. A company expected to grow earnings at 6% annually with 60% payout ratio and 9% required return would justify a P/E multiple of approximately 15 times earnings. Calculating justified multiples based on company fundamentals rather than simply accepting market multiples helps determine whether current valuations reflect appropriate compensation for growth and risk characteristics.
The PEG ratio, dividing the P/E multiple by expected earnings growth rate, provides a growth-adjusted valuation metric. PEG ratios around 1.0 suggest fair valuation, with lower figures indicating potential undervaluation relative to growth prospects. Johnson & Johnson’s PEG ratio fluctuates based on near-term growth expectations, which vary with pharmaceutical pipeline progression and medical device market conditions. Ratios consistently above 2.0 might signal overvaluation, while sustained readings below 1.5 could indicate attractive entry points for long-term investors.
Enterprise value-to-EBITDA multiples offer another perspective less affected by capital structure and accounting choices than P/E ratios. Healthcare companies typically trade at EV/EBITDA multiples of 10 to 15 times, with premium companies commanding higher multiples based on growth prospects and competitive positioning. Johnson & Johnson’s multiples relative to pharmaceutical peers like Pfizer, Merck, and AbbVie, as well as diversified healthcare competitors like Abbott Laboratories, provide context for whether current valuations reflect appropriate premiums or discounts.
Dividend Discount Model Considerations
Johnson & Johnson’s consistent dividend payments and reliable increases make dividend discount models particularly applicable for this equity. The Gordon Growth Model, assuming constant perpetual dividend growth, calculates intrinsic value as next year’s expected dividend divided by the difference between required return and growth rate. With annual dividends currently around $4.70 per share, expected growth of 5%, and required returns of 9%, the model produces intrinsic value estimates of approximately $123 per share as a baseline reference point.
Multi-stage dividend discount models provide more nuanced valuations by modeling different growth phases. An approach might project 6% dividend growth for five years during a pharmaceutical pipeline maturation phase, then 4% for another five years, before transitioning to 3% perpetual growth. Discounting these projected dividend streams back to present value at 9% required return generates more sophisticated intrinsic value estimates that reflect evolving business dynamics rather than assuming constant growth forever.
Total return expectations combining dividend yield and price appreciation potential help evaluate whether Johnson & Johnson offers adequate compensation for healthcare equity risk. If the stock trades at prices offering 3% dividend yield with realistic 5% long-term dividend growth, total returns would approximate 8% annually. Comparing this to alternative investments and personal return requirements helps determine whether the opportunity merits investment regardless of precise intrinsic value calculations.
Dividend sustainability analysis examining payout ratios, free cash flow coverage, and balance sheet capacity ensures that dividend-based valuations rest on solid foundations. Johnson & Johnson’s payout ratio typically ranges from 50% to 60% of earnings, leaving substantial retained earnings for reinvestment and providing comfortable safety margins against dividend cuts even during challenging periods. Free cash flow coverage exceeding 100% of dividends confirms that payouts come from genuine cash generation rather than borrowing or balance sheet manipulation.
Adjusting for Legal and Regulatory Risks
Johnson & Johnson faces significant legal liabilities related to talc products allegedly containing asbestos and contributing to ovarian cancer, as well as involvement in the opioid epidemic through subsidiary Janssen Pharmaceuticals. These legal challenges have resulted in substantial settlement charges and ongoing litigation that creates uncertainty around future cash flows. Conservative intrinsic value calculations should haircut baseline valuations by estimated remaining legal liability or increase discount rates to reflect elevated risk until these issues fully resolve.
The company has pursued bankruptcy proceedings through a subsidiary to manage talc liabilities, seeking to consolidate claims and establish finite settlement amounts. The ultimate resolution remains uncertain, with estimates of total liability ranging from $10 billion to potentially higher figures depending on legal outcomes. Subtracting reasonable estimates of remaining settlement obligations from calculated enterprise values before determining per-share intrinsic value ensures that valuations don’t ignore these material liabilities.
Regulatory risks around drug pricing reform, Medicare negotiation provisions in recent legislation, and international pricing pressures create additional uncertainties affecting pharmaceutical profit margins and growth prospects. While Johnson & Johnson’s diversified portfolio and focus on specialty medicines provide some insulation from generic drug pricing pressures, increasing healthcare cost scrutiny and government intervention could compress margins and slow revenue growth below historical rates. Sensitivity analysis incorporating scenarios with reduced pricing power and lower growth rates tests whether investment theses remain compelling even if regulatory headwinds intensify.
Patent cliffs, where major products lose exclusivity and face generic competition, represent predictable but significant valuation challenges. Stelara, one of Johnson & Johnson’s top-selling drugs, faces biosimilar competition that will erode its contribution to consolidated earnings. Understanding the timing and magnitude of patent expirations, management’s pipeline plans to offset lost revenues, and historical success rates in bringing new therapies to market all inform realistic growth assumptions and risk assessment in intrinsic value models.
Comparing Johnson & Johnson to Peers
Relative valuation against pharmaceutical and healthcare peers provides important context for absolute intrinsic value estimates. Companies like Merck, Pfizer, AbbVie, Bristol-Myers Squibb, and Eli Lilly operate in similar markets but with different therapeutic focuses, growth profiles, and dividend policies. Comparing price-to-earnings ratios, enterprise value multiples, dividend yields, and growth rates reveals whether Johnson & Johnson trades at premiums or discounts relative to comparable businesses.
Johnson & Johnson’s diversification across pharmaceuticals and medical devices distinguishes it from pure-play pharmaceutical competitors, potentially justifying different valuation multiples. The medical device business provides stability and reduces dependence on blockbuster drug performance, though potentially at the cost of lower overall growth rates than focused pharmaceutical companies with particularly strong pipelines. Whether this diversification warrants premium or discount multiples depends on investor preferences for stability versus growth potential.
Dividend aristocrat status and financial strength distinguish Johnson & Johnson from many peers, particularly those with higher debt loads or less consistent payout histories. Conservative dividend-oriented investors often pay premiums for this reliability, accepting potentially lower growth in exchange for greater certainty around income streams and capital return. Growth-focused investors might prefer faster-growing peers even if they carry more risk or provide smaller current yields.
Pipeline quality and breadth comparisons help assess whether Johnson & Johnson’s growth assumptions appear conservative or optimistic relative to competitive positioning. Analysis of late-stage clinical trials, recent FDA approvals, therapeutic areas under development, and management’s track record in successfully commercializing new products provides evidence for supporting or questioning growth rate assumptions used in intrinsic value calculations. Companies with superior pipelines in high-value therapeutic areas justify premium multiples relative to those facing thinner development prospects.
The Impact of Business Transformation
The Kenvue spinoff fundamentally altered Johnson & Johnson’s business composition, removing lower-margin consumer products while concentrating the remaining company on higher-growth pharmaceuticals and medical devices. This transformation potentially improves growth prospects and profitability metrics, though it also reduces diversification and eliminates a historically stable revenue stream. Intrinsic value calculations must reflect this new business mix rather than simply extrapolating historical consolidated performance that included different business economics.
Pro forma financial statements showing the continuing business without Kenvue provide appropriate baseline data for forward-looking valuations. Revenue growth rates, operating margins, cash flow generation, and capital requirements differ meaningfully from historical consolidated figures, making adjustments essential for accuracy. Companies emerging from major structural changes often see valuation multiples adjust as markets reassess appropriate comparisons and growth trajectories.
Management’s capital allocation priorities post-spinoff will significantly impact shareholder returns and intrinsic value development over time. The company has indicated intentions to pursue strategic acquisitions, particularly bolt-on deals strengthening the pharmaceutical pipeline, while maintaining dividend growth and opportunistic share repurchases. The quality of acquisition decisions, prices paid for targets, and integration success will determine whether these strategies create or destroy shareholder value relative to alternative uses of free cash flow.
The simplified business structure potentially attracts different investor constituencies than the previous conglomerate model. Growth-focused healthcare investors who previously avoided Johnson & Johnson due to consumer products drag might find the new structure more appealing, while conservative dividend investors who valued diversification might reduce allocations. These shifting demand dynamics could affect valuation multiples independently of fundamental business performance, creating opportunities or risks depending on how quickly market perceptions adjust to the new reality.
Current Market Valuation Assessment
Evaluating whether Johnson & Johnson currently trades at attractive, fair, or expensive levels relative to intrinsic value requires combining multiple analytical perspectives into coherent investment conclusions. If discounted cash flow models suggest intrinsic value in the range of $160 to $180 per share using reasonable assumptions, while the stock trades at $150, a meaningful margin of safety exists that might justify investment consideration. Conversely, if current prices around $170 exceed most intrinsic value estimates, patience waiting for better entry points might serve long-term investors better than buying at full valuations.
Historical valuation metrics provide context for current multiples, though mechanical application of historical ranges without considering changed business composition after the Kenvue spinoff risks misleading conclusions. The remaining company arguably deserves different multiples than the previous conglomerate, potentially trading at premiums reflecting higher growth or discounts if markets decide reduced diversification increases risk. Comparing current multiples to post-spinoff trading history once sufficient data accumulates will provide more relevant benchmarks than decade-long historical averages spanning different business structures.
Market sentiment toward healthcare stocks, pharmaceutical pricing concerns, and interest rate environments all influence Johnson & Johnson’s valuation independent of company-specific fundamentals. During periods when defensive dividend stocks outperform, Johnson & Johnson might trade above intrinsic value as investors pay premiums for stability. Conversely, rotation toward growth stocks or rising interest rates that make fixed-income alternatives more attractive could compress multiples below fair value, creating opportunities for patient value investors.
Technical factors including index inclusion, institutional ownership patterns, and options market activity affect supply and demand dynamics that influence price relative to intrinsic value. As a Dow Jones Industrial Average component and S&P 500 heavyweight, Johnson & Johnson benefits from consistent institutional buying through index funds while facing periodic pressure when large holders rebalance portfolios. Understanding these technical factors helps explain price movements that diverge from fundamental value changes and identify times when non-fundamental factors create temporary mispricings.
Investment Implications and Strategic Considerations
For conservative income investors, Johnson & Johnson’s combination of solid dividend yield, consistent payout growth, and defensive business characteristics makes it compelling even when trading near fair value. The stock provides portfolio stability during market volatility, reliable income streams that grow faster than inflation, and downside protection from healthcare’s non-cyclical nature. These investors might accept lower expected total returns compared to riskier alternatives in exchange for greater certainty and sleep-at-night peace of mind.
Growth-focused investors might find Johnson & Johnson less appealing unless purchasing at significant discounts to intrinsic value, as the company’s mature businesses and single-digit growth expectations limit upside potential compared to earlier-stage biotechnology firms or technology companies. However, the stock can play roles in diversified portfolios seeking exposure to healthcare innovation without accepting the binary risks inherent in clinical-stage development companies that might produce spectacular gains or total losses.
Value investors hunting for mispriced securities should focus on identifying periods when Johnson & Johnson trades at substantial discounts to conservatively calculated intrinsic values. Market overreactions to temporary setbacks, pharmaceutical industry-wide selloffs, or rotation away from defensive sectors occasionally create opportunities to purchase this quality company at 20% to 30% discounts to fair value. Patience waiting for these periods rather than buying at full valuations separates disciplined value investing from indiscriminate dividend stock accumulation.
Long-term buy-and-hold investors might dollar-cost average into positions regardless of precise market timing, recognizing that Johnson & Johnson’s business quality and dividend growth should compound wealth satisfactorily over multi-decade periods even when purchased at fair rather than discounted valuations. This approach trades potential short-term underperformance if buying before corrections for certainty of building meaningful positions in a business likely to survive and prosper across future economic cycles and healthcare industry evolution.
FAQs
What is Johnson & Johnson’s current intrinsic value per share?
Intrinsic value estimates for Johnson & Johnson vary based on analytical approaches and assumptions but generally cluster in a range depending on growth expectations, discount rates, and treatment of legal liabilities. Discounted cash flow models using mid-single-digit growth rates and 8% to 10% discount rates typically produce values between $160 and $180 per share, while earnings-based approaches and dividend discount models may suggest somewhat different figures. Rather than focusing on single-point estimates, consider ranges that reflect assumption uncertainty and compare calculated values to current market prices to assess whether adequate margins of safety exist for investment consideration.
How does the Kenvue spinoff affect Johnson & Johnson’s valuation?
The Kenvue separation fundamentally changed Johnson & Johnson’s business composition by removing lower-growth consumer products and concentrating the company on higher-margin pharmaceuticals and medical devices. This transformation potentially improves growth prospects and profitability metrics, though it reduces diversification that previously provided stability during pharmaceutical patent cliffs. Intrinsic value calculations should use pro forma financial data reflecting the continuing business without Kenvue rather than historical consolidated results. The simplified structure might justify different valuation multiples than the previous conglomerate, with markets still determining whether the new composition warrants premiums for improved growth or discounts for reduced diversification.
Is Johnson & Johnson a good dividend stock for income investors?
Johnson & Johnson ranks among the highest-quality dividend stocks available, with 61 consecutive years of payout increases demonstrating unwavering commitment to shareholder income. Current yields typically range from 2.5% to 3.5%, providing meaningful income while allowing capital appreciation potential. Dividend growth averaging 5% to 6% annually outpaces inflation and grows income streams over time. Free cash flow comfortably covers dividends with payout ratios around 50% to 60%, providing safety margins against cuts even during challenging periods. For conservative income investors prioritizing reliability over maximum yield, Johnson & Johnson represents a core holding suitable for long-term portfolios despite not offering the highest absolute yields available in equity markets.
What are the biggest risks to Johnson & Johnson’s intrinsic value?
Legal liabilities from talc litigation and opioid-related claims represent the most immediate material risks, with potential settlement costs ranging into tens of billions that could impair shareholder value if exceeding current reserves. Patent expirations on major pharmaceutical products create predictable revenue headwinds that pipeline products must offset to maintain growth. Regulatory risks including drug pricing reform, Medicare negotiation provisions, and international pricing pressures could compress margins and slow growth below historical rates. Pipeline execution risks where development candidates fail clinical trials or receive regulatory rejections would undermine growth assumptions. Generic and biosimilar competition intensifying faster than expected could erode market share and profitability across multiple product franchises simultaneously.
How does Johnson & Johnson compare to other pharmaceutical stocks?
Johnson & Johnson’s diversification across pharmaceuticals and medical devices distinguishes it from pure-play pharmaceutical competitors like Pfizer, Merck, or Eli Lilly, providing greater stability but potentially lower peak growth rates. The company’s financial strength, dividend aristocrat status, and consistent execution historically justify premium valuations relative to many peers, though specific comparisons depend on pipeline quality and growth prospects at any given time. Companies with blockbuster drugs in high-value therapeutic areas might trade at premiums during strong pipeline cycles, while those facing patent cliffs without clear replacement products trade at discounts. Johnson & Johnson typically occupies middle ground, offering balanced risk-reward profiles attractive to conservative healthcare investors rather than maximum growth potential sought by aggressive pharmaceutical stock traders.
Should I buy Johnson & Johnson stock now or wait for a better price?
This decision depends on your calculated intrinsic value, current market price, required margin of safety, investment timeline, and risk tolerance. If your analysis suggests intrinsic value significantly exceeds current market price by 20% to 30% or more, current levels might offer attractive entry points even if prices decline further short-term. If the stock trades near or above your calculated fair value, patience waiting for market corrections or business improvements that increase intrinsic value might serve you better. Dollar-cost averaging through regular purchases regardless of market timing represents a middle path suitable for long-term investors comfortable with the company’s business quality and unwilling to try timing entry points perfectly. Consider your overall portfolio construction, existing healthcare exposure, and whether Johnson & Johnson’s characteristics align with your investment objectives.
How often should I reassess Johnson & Johnson’s intrinsic value?
Quarterly reassessment when the company reports earnings ensures your valuation incorporates the latest financial performance, updated guidance, pipeline developments, and management commentary. Major business developments between quarterly reports such as significant acquisitions, drug approvals or failures, legal settlement announcements, or material competitive threats warrant immediate valuation updates if they substantially impact key assumptions. Annual deep-dive reviews examining long-term strategic positioning, competitive dynamics, and whether fundamental investment theses remain intact help distinguish temporary fluctuations from permanent changes requiring position adjustments. Maintaining documented valuation history helps track the accuracy of your analytical approach and identify systematic biases in assumptions that might benefit from calibration based on subsequent business performance.
What would make Johnson & Johnson significantly undervalued or overvalued?
Significant undervaluation would likely require market prices falling 30% or more below conservatively calculated intrinsic values, potentially occurring during broad market corrections, pharmaceutical sector selloffs, or overreactions to temporary setbacks that don’t fundamentally impair long-term value creation. Legal settlement announcements exceeding expectations, failed pipeline candidates, or regulatory setbacks might trigger such mispricings if markets extrapolate worst-case scenarios. Significant overvaluation might occur during defensive stock rotations, falling interest rate environments that inflate present values of future cash flows, or excessive optimism about pipeline products before commercial viability proves out. Comparing current multiples to historical ranges, peer valuations, and fundamentally justified levels helps identify extremes where prices diverge meaningfully from reasonable intrinsic value estimates warranting contrarian positioning.