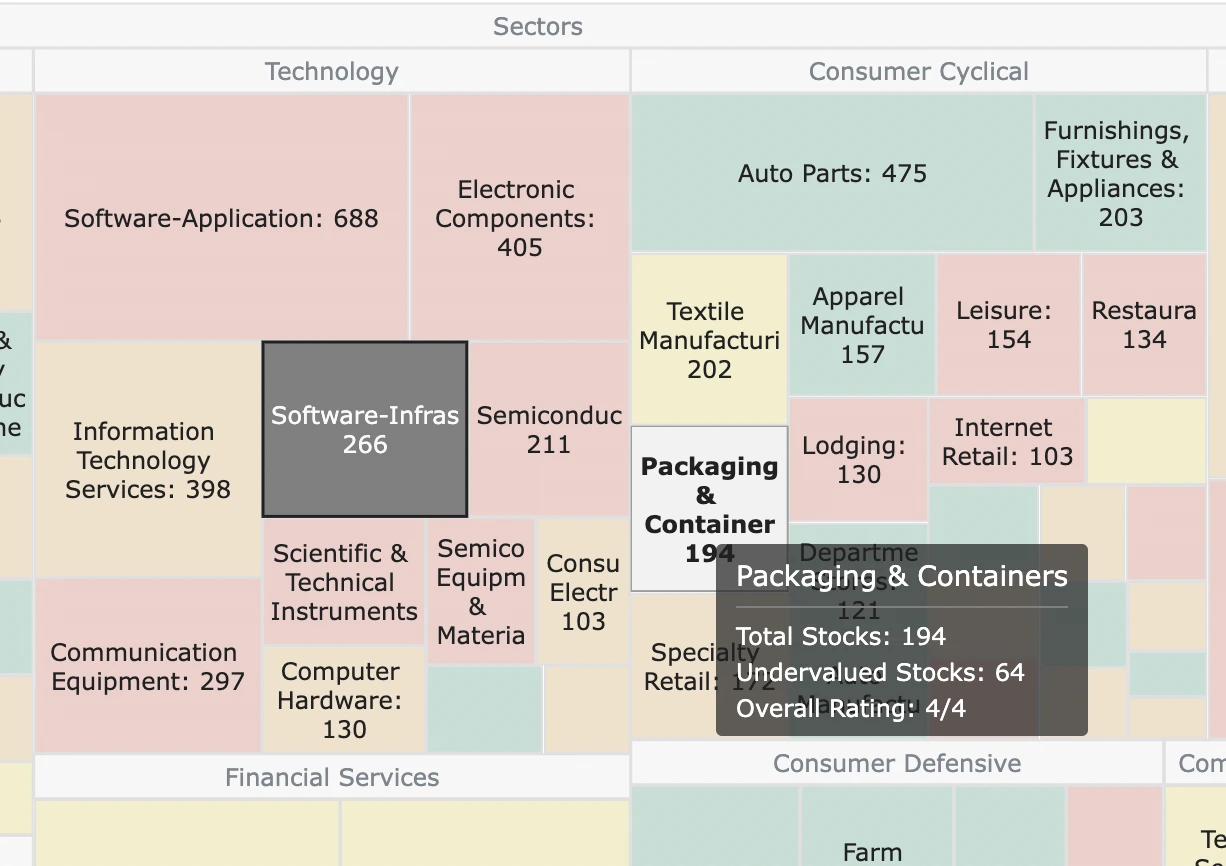
Fair value estimation, while governed by universal principles, requires significant adjustments when applied across different sectors. Perhaps no comparison illustrates this better than examining how fair value methodologies differ between high-growth technology companies and stable utility businesses. These sectors represent opposite ends of the risk-return spectrum, demanding tailored approaches to valuation that account for their unique characteristics, growth patterns, and risk profiles.
Fundamental Differences Between Technology and Utility Sectors
Growth Trajectories
Technology Sector
- Characterized by rapid, often exponential growth phases
- Revolutionary product cycles that can create entirely new markets
- Potential for dramatic revenue expansion with minimal marginal costs
- Growth rates frequently exceeding 20-30% annually during expansion phases
Utilities Sector
Explore our most popular stock fair value calculators to find opportunities where the market price is lower than the true value.
- Peter Lynch Fair Value – Combines growth with valuation using the PEG ratio. A favorite among growth investors.
- Buffett Intrinsic Value Calculator – Based on Warren Buffett’s long-term DCF approach to determine business value.
- Buffett Fair Value Model – Simplified version of his logic with margin of safety baked in.
- Graham & Dodd Fair Value – Uses conservative earnings-based valuation from classic value investing theory.
- Intrinsic vs. Extrinsic Value – Learn the core difference between what a company’s really worth and what others pay.
- Intrinsic Value Calculator – A general tool to estimate the true value of a stock, based on earnings potential.
- Fama-French Model – For advanced users: Quantifies expected return using size, value and market risk.
- Discount Rate Calculator – Helps estimate the proper rate to use in any DCF-based valuation model.
- Steady, predictable growth typically aligned with population growth or inflation
- Mature markets with established demand patterns
- Capital-intensive expansion requiring significant investment for incremental revenue
- Growth rates typically in the 1-3% range annually
Business Model Stability
Technology Sector
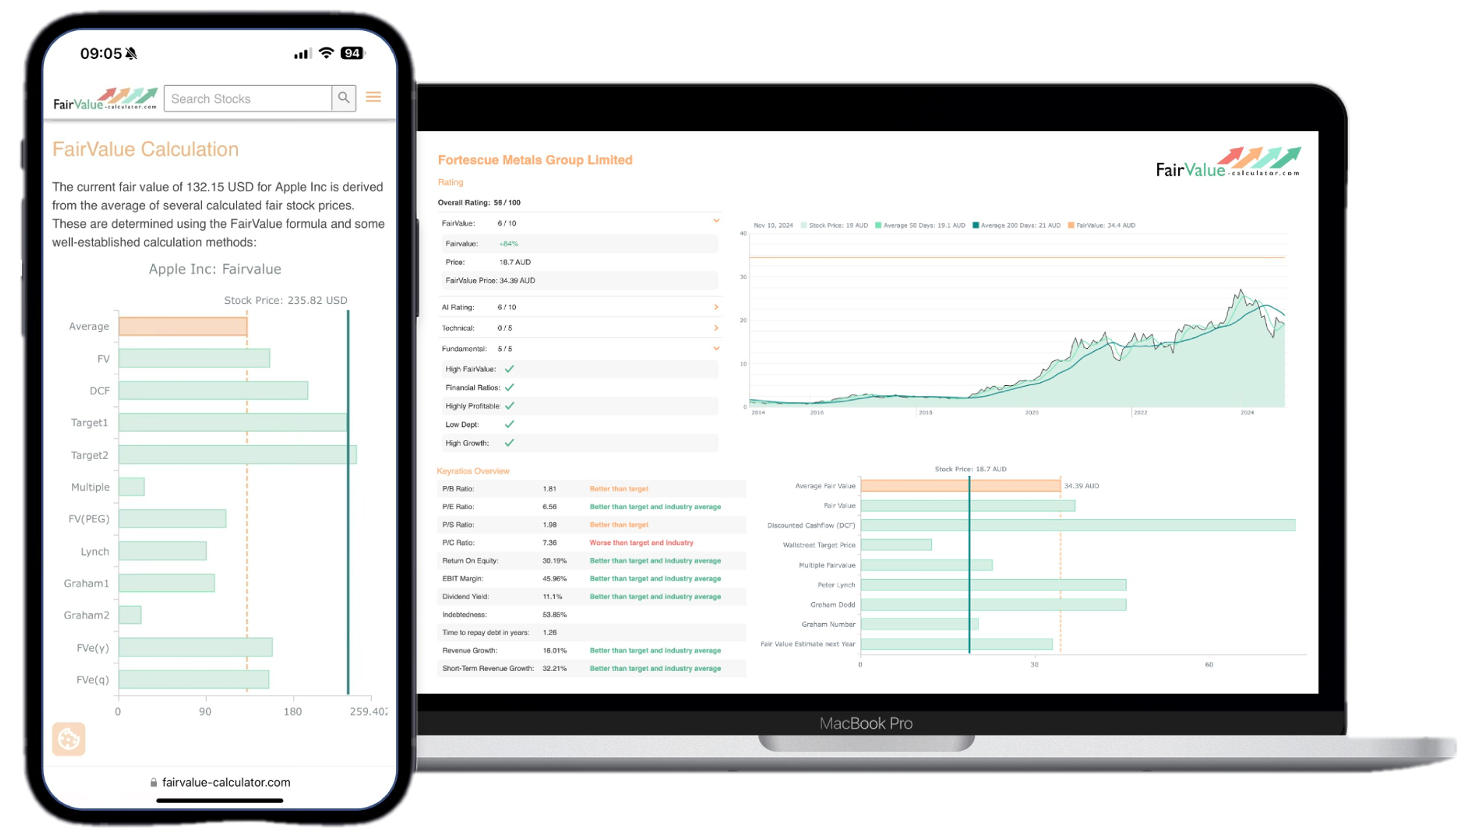
💡 Discover Powerful Investing Tools
Stop guessing – start investing with confidence. Our Fair Value Stock Calculators help you uncover hidden value in stocks using time-tested methods like Discounted Cash Flow (DCF), Benjamin Graham’s valuation principles, Peter Lynch’s PEG ratio, and our own AI-powered Super Fair Value formula. Designed for clarity, speed, and precision, these tools turn complex valuation models into simple, actionable insights – even for beginners.
Learn More About the Tools →- Disruptive business models that can rapidly obsolete existing technologies
- Winner-takes-all dynamics in many subsectors due to network effects
- Shorter product lifecycles requiring continuous innovation
- Volatile competitive landscapes with frequent market entrants
Utilities Sector
- Regulated monopoly status in many markets
- Essential services with inelastic demand
- Extremely long asset lifespans (often 30+ years)
- Stability reinforced by high barriers to entry and regulatory frameworks

Risk Profiles
Technology Sector
- High execution risk related to product development and market acceptance
- Significant competitive threats from both established players and startups
- Technological obsolescence risk
- Often dependent on key talent and intellectual property
Utilities Sector
- Regulatory risk as the primary concern
- Interest rate sensitivity due to capital structure
- Long-term environmental compliance risks
- Natural disaster and infrastructure resilience risks
Adjusting Valuation Methodologies
Discounted Cash Flow (DCF) Adaptations
Technology Sector DCF Considerations
- Extended forecast periods (10+ years) to capture growth cycles
- Terminal values often representing 70-80% of total valuation
- Higher discount rates reflecting elevated business risk
- Multiple scenarios to account for breakthrough success vs. competitive failure
- Option-based valuation components for early-stage ventures
Utilities Sector DCF Considerations
- Highly detailed near-term forecasts reflecting regulatory rate cases
- Emphasis on free cash flow to equity given consistent dividend expectations
- Lower discount rates aligned with reduced business volatility
- Greater focus on debt service capacity and capital structure
- Incorporation of regulatory asset base (RAB) models in relevant jurisdictions
Growth Assumptions and Terminal Value
Technology Terminal Value Approaches
- Two-stage or three-stage growth models to reflect maturation phases
- Initial high-growth periods followed by step-downs to sustainable levels
- Exit multiples often used alongside perpetuity methods as a reality check
- Significant sensitivity analysis around long-term growth rates
Utilities Terminal Value Approaches
- Greater reliance on perpetuity growth models
- Terminal growth closely tied to population growth and inflation expectations
- Regulatory return on invested capital (ROIC) as a ceiling on growth potential
- Asset replacement value as a supplementary valuation check
Comparable Analysis Refinements
Technology Comparable Considerations
- Forward-looking multiples emphasized over trailing metrics
- Revenue multiples often more relevant than earnings-based metrics
- Cohort analysis based on growth rates and market position
- Customer lifetime value (CLV) and customer acquisition cost (CAC) metrics
- Emphasis on gross margins and scalability potential
Utilities Comparable Considerations
- Yield-based comparisons, including dividend yield and earnings yield
- Enterprise Value to Regulated Asset Base (EV/RAB) metrics
- Regulatory jurisdiction similarities as a key grouping factor
- Price-to-earnings (P/E) and EV/EBITDA within narrow trading ranges
- Rate base growth as a key performance indicator
Key Financial Metrics and Value Drivers
Technology Sector Key Metrics
- Revenue Growth Rate
- Often the primary driver of valuation, particularly for early-stage companies
- Year-over-year growth and sequential quarter growth closely monitored
- Expectations frequently set for doubling or tripling of revenue in early stages
- Gross Margin
- Indicator of pricing power and long-term profit potential
- Software companies typically achieve 70-90% gross margins
- Hardware businesses generally fall in the 30-60% range
- Customer Metrics
- Monthly/Annual Recurring Revenue (MRR/ARR) for subscription businesses
- Net Revenue Retention (NRR) measuring expansion within existing customers
- Customer Acquisition Cost (CAC) and payback periods
- Churn rates and customer lifetime value
- Research & Development Intensity
- R&D as a percentage of revenue
- New product introduction rates
- Patent generation and intellectual property development
Utilities Sector Key Metrics
- Regulated Asset Base (RAB)
- The foundation for allowed returns in many regulatory frameworks
- Growth in RAB as an indicator of future earnings potential
- Ratio of market capitalization to RAB as a valuation benchmark
- Allowed Return on Equity
- Regulatory-approved return levels compared to actual performance
- Spread between allowed returns and cost of capital
- Historical ability to earn or exceed allowed returns
- Operational Efficiency
- Cost per customer or unit of service delivered
- System reliability metrics (SAIDI, SAIFI in electric utilities)
- Capacity utilization rates
- Regulatory Climate
- Constructiveness of regulatory relationships
- Frequency and predictability of rate cases
- Recovery mechanisms for capital investments
- Environmental compliance requirements and timelines
Risk Assessment and Discount Rate Determination
Cost of Capital Considerations
Technology Sector WACC Components
- Equity risk premiums typically 1-3% higher than market average
- Beta coefficients frequently above 1.5 for high-growth tech
- Liquidity premiums for earlier-stage companies
- Small-cap premiums where applicable
- Resulting WACC often in the 12-20% range
Utilities Sector WACC Components
- Equity risk premiums often below market average
- Beta coefficients typically in the 0.5-0.8 range
- Significant debt component (often 50-60% of capital structure)
- Favorable debt terms due to asset security and cash flow stability
- Resulting WACC typically in the 5-8% range
Risk Factor Analysis
Technology Risk Factors
- Market creation/product-market fit risk
- Technology development risk
- Competitive disruption risk
- Key person dependencies
- Intellectual property protection
- Scaling/execution risk
Utilities Risk Factors
- Regulatory risk including disallowed costs
- Rate case timing and outcomes
- Interest rate sensitivity
- Infrastructure replacement needs
- Environmental compliance requirements
- Weather-related demand fluctuations
- Long-term energy transition risks
Fair Value Accounting Considerations
The application of fair value accounting standards (such as IFRS 13 or ASC 820) also varies significantly between these sectors:
Technology Sector Fair Value Accounting Issues
- Valuation of stock-based compensation in talent-competitive environments
- Accounting for acquisitions with significant intellectual property components
- Impairment testing for rapidly evolving technology assets
- Revenue recognition complexities with bundled offerings
- Determination of development costs eligible for capitalization
Utilities Sector Fair Value Accounting Issues
- Regulatory accounting treatment of assets and allowed returns
- Asset retirement obligations for long-lived infrastructure
- Hedging and derivative accounting for fuel and interest rate management
- Rate-regulated activities accounting under IFRS
- Impairment considerations for long-duration assets
Real-World Valuation Examples
Technology Valuation Approach
Software-as-a-Service (SaaS) Company Valuation Framework
- Near-term focus on ARR growth rate and net revenue retention
- Emphasis on Rule of 40 (growth rate + profit margin ≥ 40%)
- Comparable analysis using EV/Revenue multiples adjusted for growth
- DCF with high initial growth (25-40%), gradual step-down, and terminal growth of 3-4%
- Discount rates in 12-15% range with sensitivity analysis
Consider a hypothetical SaaS company growing at 35% annually with 120% net revenue retention.
Valuation might employ:
- EV/Revenue multiple of 10-15x forward revenue
- DCF with 5-year high-growth phase, 5-year transition, 3% terminal growth
- 15% discount rate reflecting business model stability but competitive risk
Utilities Valuation Approach
Regulated Electric Utility Valuation Framework
- Near-term focus on regulatory rate base growth and allowed ROE
- Detailed modeling of approved capital expenditure programs
- Comparable analysis using P/E and dividend yield metrics
- DCF with modest growth (3-5%), stable margins, and terminal growth of 1.5-2%
- Discount rates in 5-7% range with emphasis on regulatory scenarios
Consider a hypothetical electric utility with a $10 billion rate base growing at 4% annually with a 10% allowed ROE.
Valuation might employ:
- P/E multiple of 15-18x forward earnings
- Dividend yield comparison against peer utilities
- DCF with explicit 5-year forecast, 2% terminal growth
- 6% discount rate reflecting regulatory stability but interest rate sensitivity
Investment Decision Frameworks
The distinct characteristics of these sectors lead to different approaches for investment decision-making:
Technology Investment Framework
- Growth-oriented metrics dominating valuation
- Emphasis on addressable market size and penetration rates
- Competitive positioning and moat assessment
- Product roadmap evaluation
- Management team experience and vision
- Often involves accepting near-term losses for long-term value creation
Utilities Investment Framework
- Income-oriented metrics dominating valuation
- Emphasis on dividend sustainability and growth
- Regulatory jurisdiction analysis
- Rate base growth opportunities
- Balance sheet strength and debt service capacity
- Focus on preservation of capital with modest appreciation potential
Conclusion: Bridging the Valuation Divide
While technology and utility valuations employ fundamentally different approaches, both ultimately seek to determine fair value based on future cash flow generation adjusted for risk.
The principles remain consistent even as the application varies dramatically:
Time Horizon Adjustment: Technology valuations require longer-term thinking with greater uncertainty, while utilities demand more precise near-term forecasts.
Risk-Return Calibration: The higher growth potential of technology must be balanced against greater uncertainty, while utilities offer more predictable returns with lower volatility.
Qualitative Factor Weighting: Technology valuations place greater emphasis on market disruption potential and innovation capacity, while utilities focus on regulatory relationships and operational excellence.
Valuation Method Selection: While DCF remains fundamental to both sectors, technology often benefits from scenario analysis and option-based approaches, while utilities are well-suited to stable-growth perpetuity models.
Financial analysts and investors who understand these sector-specific nuances can develop more accurate fair value estimates that appropriately reflect the distinctive risk-return profiles of technology and utility investments. By recognizing that fair value principles must be adaptively applied rather than rigidly implemented, practitioners can avoid the pitfalls of misapplied methodologies and develop valuations that truly reflect the economic realities of these divergent sectors.