When valuing investments, projects, or assets, we often encounter cash flows that don’t arrive at regular intervals. Traditional NPV and IRR functions in Excel assume periodic cash flows (annual, quarterly, monthly), but real-world scenarios are rarely that neat. Enter XNPV and XIRR, two powerful functions designed specifically for irregular cash flow timing.
Why Regular NPV and IRR Fall Short
The standard =NPV(rate, values) and =IRR(values) functions assume cash flows occur at regular intervals. If you’re analyzing:
- Private equity investments with irregular capital calls and distributions
- Real estate projects with uneven construction draws and lease-up periods
- Venture capital investments with milestone-based funding rounds
- Project finance with irregular payment schedules
…then NPV and IRR will give you inaccurate results because they can’t account for the actual timing of cash flows.
Understanding XNPV: Net Present Value with Dates
The Formula Structure
=XNPV(rate, values, dates)Parameters:
Explore our most popular stock fair value calculators to find opportunities where the market price is lower than the true value.
- Peter Lynch Fair Value – Combines growth with valuation using the PEG ratio. A favorite among growth investors.
- Buffett Intrinsic Value Calculator – Based on Warren Buffett’s long-term DCF approach to determine business value.
- Buffett Fair Value Model – Simplified version of his logic with margin of safety baked in.
- Graham & Dodd Fair Value – Uses conservative earnings-based valuation from classic value investing theory.
- Intrinsic vs. Extrinsic Value – Learn the core difference between what a company’s really worth and what others pay.
- Intrinsic Value Calculator – A general tool to estimate the true value of a stock, based on earnings potential.
- Fama-French Model – For advanced users: Quantifies expected return using size, value and market risk.
- Discount Rate Calculator – Helps estimate the proper rate to use in any DCF-based valuation model.
rate: The discount rate (annual percentage)values: Range of cash flow amountsdates: Corresponding dates for each cash flow
How XNPV Calculates
XNPV discounts each cash flow based on its exact date relative to the first date in your series:
PV = Cash Flow / (1 + rate)^(days/365)
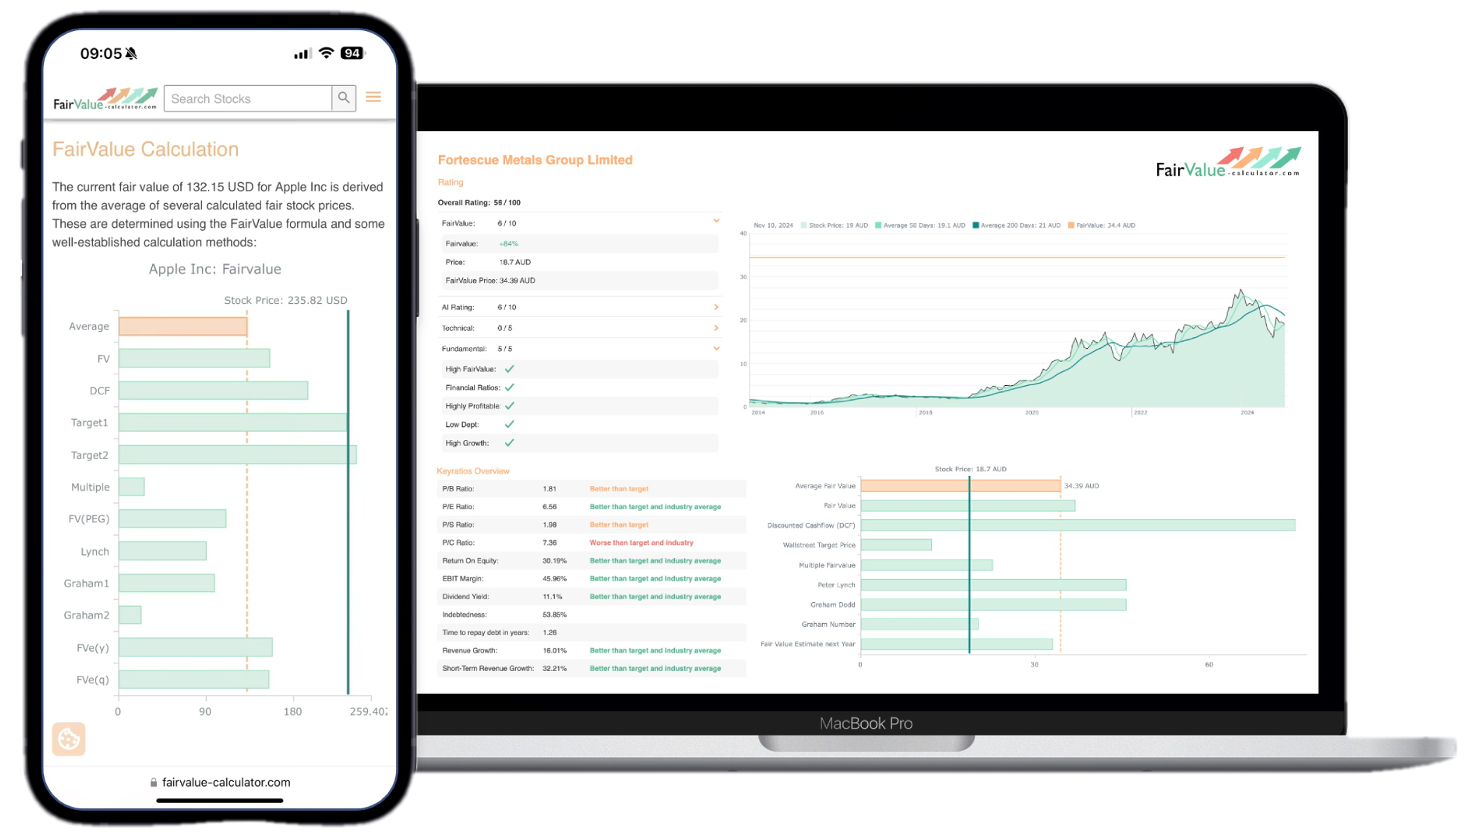
💡 Discover Powerful Investing Tools
Stop guessing – start investing with confidence. Our Fair Value Stock Calculators help you uncover hidden value in stocks using time-tested methods like Discounted Cash Flow (DCF), Benjamin Graham’s valuation principles, Peter Lynch’s PEG ratio, and our own AI-powered Super Fair Value formula. Designed for clarity, speed, and precision, these tools turn complex valuation models into simple, actionable insights – even for beginners.
Learn More About the Tools →The function calculates the number of days between each cash flow date and the first date, then applies continuous compounding based on a 365-day year.
Building an XNPV Model
Let’s create a practical example for a real estate development project:
Step 1: Set Up Your Data Structure
| Date | Description | Cash Flow |
|---|---|---|
| 1/15/2024 | Land Purchase | -$2,000,000 |
| 3/22/2024 | Construction Draw 1 | -$500,000 |
| 7/10/2024 | Construction Draw 2 | -$750,000 |
| 11/5/2024 | Construction Draw 3 | -$800,000 |
| 2/20/2025 | Lease-up Complete | -$150,000 |
| 3/1/2025 | First Rental Income | $45,000 |
| 6/1/2025 | Quarterly Income | $45,000 |
| 9/1/2025 | Quarterly Income | $45,000 |
| 12/1/2025 | Quarterly Income | $45,000 |
| 12/15/2025 | Sale of Property | $3,850,000 |
Step 2: Set Your Discount Rate
In cell E2, enter your required return rate: 12%
Step 3: Apply the XNPV Formula
Assuming dates are in column A (A2:A11), and cash flows in column C (C2:C11):
=XNPV(E2, C2:C11, A2:A11)This calculates the net present value accounting for the exact timing of each cash flow. If the result is positive, the project creates value at your required return rate.
Advanced XNPV Applications
Scenario Analysis
Create multiple scenarios by varying your discount rate:
| Discount Rate | XNPV |
|---|---|
| 8% | =XNPV(0.08, $C$2:$C$11, $A$2:$A$11) |
| 10% | =XNPV(0.10, $C$2:$C$11, $A$2:$A$11) |
| 12% | =XNPV(0.12, $C$2:$C$11, $A$2:$A$11) |
| 15% | =XNPV(0.15, $C$2:$C$11, $A$2:$A$11) |
Breaking Out Value Components
You can analyze different cash flow components separately:
Initial Investment NPV: =XNPV(E2, C2:C5, A2:A5)Operating Cash Flow NPV: =XNPV(E2, C6:C9, A6:A9)Terminal Value NPV: =XNPV(E2, C10, A10)Understanding XIRR: Internal Rate of Return with Dates
The Formula Structure
=XIRR(values, dates, [guess])Parameters:
values: Range of cash flow amounts (must include at least one positive and one negative)dates: Corresponding dates for each cash flowguess: Optional starting point for iteration (default is 10%)
What XIRR Solves For
XIRR finds the discount rate that makes the XNPV equal to zero. It answers the question: “What annualized return does this investment generate given the actual timing of cash flows?”
Building an XIRR Model
Using the same real estate example:
Basic XIRR Calculation
=XIRR(C2:C11, A2:A11)This returns the annualized IRR accounting for irregular timing. The result shows your actual return rate, considering when money goes out and comes in.
XIRR Best Practices
1. Always Include Exact Dates
XIRR is sensitive to timing. A cash flow on January 1st versus January 31st can meaningfully impact your IRR:
Early cash flow: =XIRR({-100000, 110000}, {DATE(2024,1,1), DATE(2024,12,31)})Result: ~10.5%Late cash flow: =XIRR({-100000, 110000}, {DATE(2024,1,31), DATE(2024,12,31)})Result: ~11.3%2. Structure Cash Flows Correctly
- Investments/outflows should be negative
- Returns/inflows should be positive
- Must have at least one positive and one negative value
3. Use the Guess Parameter for Complex Models
If XIRR returns a #NUM! error, it means the function couldn’t converge on a solution. Try providing a guess:
=XIRR(C2:C11, A2:A11, 0.15)Start with 15% as a guess and adjust if needed.
Combining XNPV and XIRR in a Complete Model
Let’s build a comprehensive valuation model for a private equity investment:
Model Setup
Investment Parameters (Assumptions Section):
- Initial Investment Date: 1/15/2024
- Exit Date: 12/31/2028
- Required Return: 18%
Capital Calls and Distributions:
| Date | Type | Amount | Formula |
|---|---|---|---|
| 1/15/2024 | Initial Call | -$5,000,000 | (manual entry) |
| 6/30/2024 | Follow-on Call | -$2,000,000 | (manual entry) |
| 12/15/2025 | Recapitalization | $1,500,000 | (manual entry) |
| 6/30/2027 | Partial Exit | $3,000,000 | (manual entry) |
| 12/31/2028 | Final Exit | $8,500,000 | (manual entry) |
Key Metrics Dashboard
Net Investment: =SUM(C2:C6)Result: -$4,000,000Total Returns: =SUMIF(C2:C6, ">0")Result: $13,000,000Gross Multiple: =SUMIF(C2:C6, ">0")/ABS(SUMIF(C2:C6, "<0"))Result: 1.86xXNPV at Required Return: =XNPV(18%, C2:C6, A2:A6)Result: $1,245,000 (value created above required return)Actual XIRR: =XIRR(C2:C6, A2:A6)Result: 23.4% (annualized return)Decision Logic
Add conditional formatting or formulas to automate decision-making:
Investment Decision: =IF(XNPV(required_return, cash_flows, dates)>0, "ACCEPT", "REJECT")Return vs. Hurdle: =XIRR(cash_flows, dates) - required_returnResult: 5.4% (exceeds hurdle by 540 basis points)Common Pitfalls and Solutions
Pitfall 1: Date Formatting Issues
Problem: Dates stored as text won’t work with XNPV/XIRR.
Solution: Ensure dates are in Excel date format. Use =DATEVALUE() to convert text dates or =DATE(year, month, day) to construct dates.
Correct: =DATE(2024, 1, 15)Incorrect: "1/15/2024" (as text)Pitfall 2: Unsorted Dates
Problem: Cash flows entered out of chronological order.
Solution: While XNPV and XIRR can handle unsorted dates, best practice is to sort chronologically to avoid errors and improve model clarity.
Pitfall 3: Missing the Initial Investment Sign
Problem: Forgetting to make the initial investment negative.
Solution: Investments are outflows (negative), returns are inflows (positive).
Wrong: =XIRR({100000, 110000}, {DATE(2024,1,1), DATE(2025,1,1)})Right: =XIRR({-100000, 110000}, {DATE(2024,1,1), DATE(2025,1,1)})Pitfall 4: Confusing Annual Rate with Period Rate
Problem: Using monthly or quarterly rates instead of annual rates.
Solution: XNPV and XIRR work with annual rates and adjust internally based on actual dates. Always input annual percentages.
Advanced Technique: Sensitivity Tables
Create a two-variable data table to see how XNPV changes with different discount rates and exit values:
Setup:
- Create your base XNPV formula in a cell
- Use Data > What-If Analysis > Data Table
- Set Row Input Cell to your exit value assumption
- Set Column Input Cell to your discount rate assumption
This generates a sensitivity matrix showing how your valuation changes across scenarios.
Advanced Technique: Monte Carlo Simulation
For sophisticated risk analysis, combine XNPV with random variables:
Random Exit Value: =NORM.INV(RAND(), mean_exit, std_dev_exit)Random Exit Date: =DATE(2028, RANDBETWEEN(1,12), RANDBETWEEN(1,28))Simulated XNPV: =XNPV(discount_rate, cash_flow_range, date_range)Run 1,000+ iterations (F9 to recalculate) and analyze the distribution of outcomes.
Practical Example: Comparing Two Investment Opportunities
Investment A: Steady Eddy
- $100,000 invested on 1/1/2024
- $25,000 received quarterly for 5 years
- Regular, predictable cash flows
Investment B: Lumpy Returns
- $100,000 invested on 1/1/2024
- No cash flow for 3 years
- $175,000 received on 12/31/2026
Analysis Setup:
| Investment A | Date | Cash Flow |
|---|---|---|
| Initial | 1/1/2024 | -$100,000 |
| Q1-Q20 | Various | $25,000 each |
Investment A XIRR: =XIRR(A_cashflows, A_dates)Investment A XNPV: =XNPV(12%, A_cashflows, A_dates)| Investment B | Date | Cash Flow |
|---|---|---|
| Initial | 1/1/2024 | -$100,000 |
| Exit | 12/31/2026 | $175,000 |
Investment B XIRR: =XIRR(B_cashflows, B_dates)Investment B XNPV: =XNPV(12%, B_cashflows, B_dates)Even if both show similar XIRR values, the XNPV at your required return rate tells you which creates more value. Earlier cash flows (Investment A) have reinvestment value that XNPV captures but XIRR doesn’t.
When to Use XNPV vs. XIRR
Use XNPV when:
- You need to compare projects of different sizes
- You want to know absolute value creation
- You have a clear required return rate
- You’re adding multiple projects together
Use XIRR when:
- You want to know the percentage return
- You’re comparing efficiency across investments
- You need a single metric for fund performance
- You’re reporting to stakeholders who think in terms of returns
Use both when:
- Making investment decisions (XNPV) and reporting results (XIRR)
- You want a complete picture of value and returns
- Building comprehensive investment memos
Conclusion
XNPV and XIRR are essential tools for any serious financial modeler dealing with real-world cash flows. They bring precision to valuation by accounting for the actual timing of cash movements, not just their magnitude.
Key Takeaways:
- Use XNPV for valuation decisions, it tells you if value is created
- Use XIRR for performance reporting, it tells you the rate of return
- Always ensure dates are properly formatted and chronologically sensible
- Combine these functions with scenario analysis for robust decision-making
- Remember: garbage in, garbage out, accurate dates and cash flows are critical
By mastering these functions, you’ll build more accurate models that reflect the economic reality of irregular cash flows, leading to better investment decisions and more credible valuations.
Ready to calculate fair value with precision? Explore more valuation tools and calculators at FairValue-Calculator.com.