In the labyrinthine world of investing, determining a stock’s fair value can feel like finding your way through a dense forest without a compass. With the staggering variety of sectors, each with its unique characteristics and market dynamics, investors often find themselves at crossroads, unsure of the path to take. The stakes are even higher in today’s volatile markets, where tech stocks, utilities, and financials each dance to their own distinct tune. Understanding *how to compute fair value for tech stocks vs utilities vs financials* is no longer just a skill; it’s a necessity for making informed investment decisions.
Imagine standing at a stock market buffet with a plate in hand, overwhelmed by an assortment of options. Tech stocks flash their rapid innovation and growth potential, while utilities offer stability and steady dividends. Meanwhile, financial stocks boast of lucrative returns tied to economic cycles. It’s a dizzying array, but knowing how to differentiate and properly assess each type can not only enhance your investment strategy but also arm you with the knowledge to navigate market fluctuations with confidence. This blog post will unravel these complexities, providing you with the insights needed to decode the art of valuation across these pivotal sectors.

Understanding Valuation Fundamentals
At its core, valuation is the process of estimating the intrinsic worth of a company based on its cash flows, assets, liabilities, and growth prospects. Investors rely on these calculations to determine if a stock is undervalued, overvalued, or reasonably priced relative to its current market price. Fundamental frameworks such as discounted cash flow (DCF), price-to-earnings (P/E) multiples, and net asset value (NAV) serve as the foundation for these assessments. While these methodologies share common principles, their application must be tailored to each sector’s distinctive traits.
Importantly, the inputs and assumptions underpinning valuation models, like future revenue growth rates, discount rates, and terminal values, can dramatically sway outcomes. Analysts must carefully scrutinize industry trends, competitive dynamics, and macroeconomic factors when choosing their assumptions. As we explore tech stocks, utilities, and financials, this section sets the stage for a deeper dive into how these fundamentals evolve across sectors, addressing exactly how to compute fair value for tech stocks vs utilities vs financials in practice.
Analyzing Tech Stocks: Factors Affecting Fair Value
Valuing technology companies presents a unique set of variables due to their rapid innovation cycles, intangible assets, and often unpredictable growth trajectories. Two major drivers, research and development (R&D) expenditure and intellectual property, can either propel a tech firm forward or burden it with high burn rates and uncertain returns. Investors must weigh the balance between aggressive reinvestment and near-term profitability when computing fair value.
Additionally, market sentiment and competitive moats play an outsized role in tech valuations. A strong brand, proprietary platforms, or network effects can justify higher multiples, while regulatory scrutiny or disruptive entrants can erode perceived worth. Understanding these nuances is critical for anyone who wants to understand how to compute fair value for tech stocks vs utilities vs financials, as it highlights the importance of tailoring your valuation model to reflect sector-specific dynamics.
Valuation Metrics for Utilities: Comparing Methods
Utility companies are characterized by stable cash flows, regulated returns, and significant capital expenditure needs. As a result, traditional valuation models like discounted cash flow (DCF) and dividend discount model (DDM) are commonly used to compute their fair value. Investors often look at metrics such as the price-to-earnings ratio (P/E), price-to-book ratio (P/B), and yield on equity to gauge relative attractiveness.
Regulatory frameworks and rate cases can significantly impact these metrics. Because utilities operate in tightly controlled environments, predictability of cash flows is higher, which justifies lower discount rates in DCF models. When comparing methods, one must assess which approach aligns best with a company’s capital structure, dividend policy, and regional regulatory environment to accurately determine fair value.
Explore our most popular stock fair value calculators to find opportunities where the market price is lower than the true value.
- Peter Lynch Fair Value – Combines growth with valuation using the PEG ratio. A favorite among growth investors.
- Buffett Intrinsic Value Calculator – Based on Warren Buffett’s long-term DCF approach to determine business value.
- Buffett Fair Value Model – Simplified version of his logic with margin of safety baked in.
- Graham & Dodd Fair Value – Uses conservative earnings-based valuation from classic value investing theory.
- Intrinsic vs. Extrinsic Value – Learn the core difference between what a company’s really worth and what others pay.
- Intrinsic Value Calculator – A general tool to estimate the true value of a stock, based on earnings potential.
- Fama-French Model – For advanced users: Quantifies expected return using size, value and market risk.
- Discount Rate Calculator – Helps estimate the proper rate to use in any DCF-based valuation model.

Financial Stocks Valuation: Unraveling the Challenges
Financial institutions, from banks and insurance firms to asset managers and fintechs, pose distinct challenges in valuation due to their leverage, regulatory oversight, and exposure to interest rate cycles. One common approach is the use of price-to-book (P/B) multiples, reflecting the sector’s emphasis on balance sheet strength and capital adequacy. Analysts also employ dividend discount models (DDM) for banks with stable payout ratios.
However, non-performing assets, loan loss provisions, and off-balance-sheet exposures can introduce substantial uncertainty. Scenario analysis and stress testing become essential tools for evaluating downside risk, while capital return metrics such as return on equity (ROE) and return on tangible common equity (ROTCE) help assess management’s efficiency. Grasping these nuances is vital for understanding how to compute fair value for tech stocks vs utilities vs financials, since each sector’s fundamentals and risk drivers differ so markedly.
Market Dynamics Impacting Tech Stock Valuation
Tech valuations are heavily influenced by market trends like digital transformation, cloud computing adoption, and artificial intelligence breakthroughs. Shifts in consumer behavior and enterprise IT spending can quickly change growth expectations for tech companies. As such, discount rates and terminal growth assumptions in valuation models must account for both rapid scaling opportunities and potential obsolescence risks.
Moreover, public market sentiment can swing wildly around earnings announcements, product launches, or regulatory actions. High beta characteristics mean that tech stocks often experience larger swings relative to broader indices, making sensitivity analyses and scenario planning indispensable components of any robust valuation process.
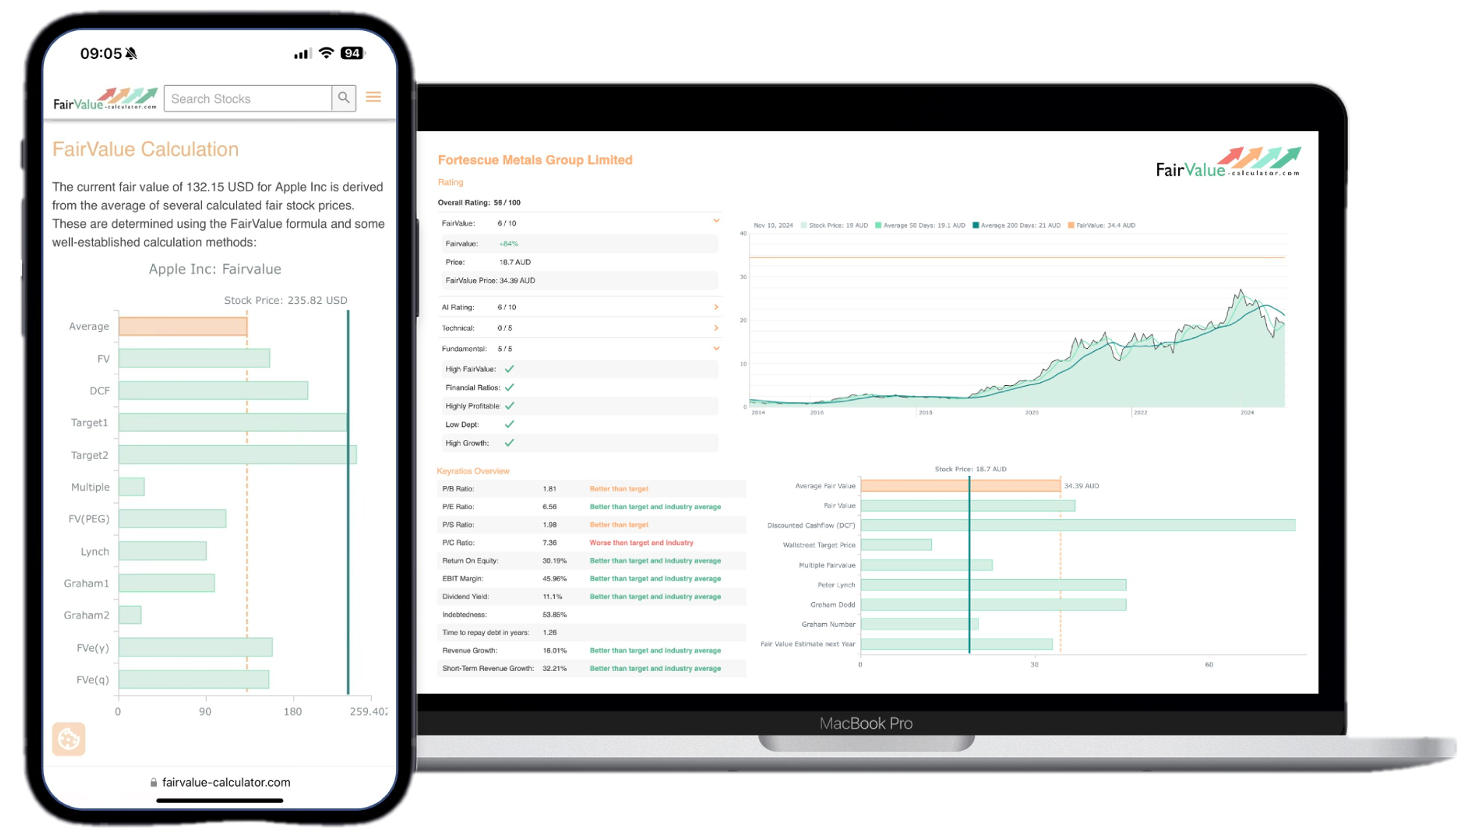
💡 Discover Powerful Investing Tools
Stop guessing – start investing with confidence. Our Fair Value Stock Calculators help you uncover hidden value in stocks using time-tested methods like Discounted Cash Flow (DCF), Benjamin Graham’s valuation principles, Peter Lynch’s PEG ratio, and our own AI-powered Super Fair Value formula. Designed for clarity, speed, and precision, these tools turn complex valuation models into simple, actionable insights – even for beginners.
Learn More About the Tools →Regulatory Influences on Utilities Fair Value
Utilities function in an environment where government agencies set allowable rates of return and approve capital projects. Regulatory decisions on rate cases, environmental mandates, and infrastructure spending have direct implications for revenue streams and cost structures. When computing fair value, investors must monitor pending legislation, regulatory reviews, and changes to tariff frameworks.
These factors can either enhance stability, by guaranteeing cost recovery and target returns, or create headwinds if regulators impose stricter efficiency targets or rate caps. Consequently, incorporating regulatory risk premiums or adjusting discount rates in your DCF and DDM models is critical for an accurate assessment of intrinsic value.
Economic Indicators and Financial Stocks Valuation
Financial institutions’ performance is closely tied to macroeconomic variables such as interest rates, credit growth, and unemployment levels. Rising rates can boost net interest margins for banks, while weak economic data may increase default rates and provisions for non-performing loans. Investors use yield curve analysis and interest rate forecasts to refine their valuation models.
Other indicators like consumer confidence, housing starts, and corporate debt issuance inform projections for loan books and fee-based revenues. A comprehensive valuation for financial stocks requires integrating these economic insights into stress tests, capital adequacy scenarios, and dividend sustainability assessments to arrive at a realistic fair value.

Comparative Analysis of Valuation Approaches
When comparing valuation approaches across tech, utilities, and financials, it becomes clear that no one-size-fits-all model exists. Tech firms often demand high-growth DCF analyzes with elevated discount rates, while utilities call for conservative DDM or regulated asset base (RAB) models with low cost of capital. Financial stocks, on the other hand, lean heavily on P/B multiples and dividend forecasts tied to macro variables.
Investors should employ a mix of relative multiples and intrinsic valuation methods, calibrating each to sector-specific drivers. Cross-sector comparisons can help identify relative over- or under-valuation, but they must be tempered by an understanding of each industry’s unique risk profile and cash flow characteristics.
Risk Assessment Across Tech, Utilities, and Financials
Risk factors vary widely among these sectors: technological disruption and competitive intensity dominate in tech, while regulatory changes and capital expenditure risk prevail in utilities. Financials face credit risk, leverage risk, and systemic shocks tied to economic cycles. A comprehensive risk assessment involves scenario analysis, stress testing, and sensitivity analysis for key inputs like discount rates and growth forecasts.
In practice, investors should construct a risk-adjusted discount rate or incorporate a margin of safety to account for sector-specific uncertainties. By doing so, you ensure that your fair value estimates for tech stocks, utilities, and financials are resilient to both idiosyncratic and market-wide shocks.
Conclusion: Navigating Stock Valuation in Diverse Sectors
Mastering valuation requires both a solid grasp of fundamental models and an appreciation for each sector’s nuances. Whether you’re valuing a high-flying tech innovator, a dividend-paying utility, or a cycle-sensitive bank, your approach must be tailored to the unique drivers of cash flow and risk.
By integrating sector-specific metrics, adjusting your assumptions for market dynamics, and applying robust risk assessments, you’ll be well-equipped to navigate the complexities of how to compute fair value for tech stocks vs utilities vs financials. Armed with these insights, you can make more informed investment decisions and uncover opportunities that others may overlook.