Understanding the intricacies of financial metrics can often feel like navigating a maze without a map. Yet, one of the cornerstones of financial analysis that savvy investors rely on is the Return on Equity (ROE). Whether you’re a seasoned investor or someone just dipping their toes into the world of finance, mastering the equity return formula is a crucial step towards making informed investment decisions. ROE serves as a mirror, reflecting how efficiently a company utilizes its shareholders’ equity to generate profits. In this blog post, we’ll demystify the process, providing you not just with the formula but also with expert insights and tips to harness its power effectively.
Imagine standing at the crossroads of investment decisions, equipped with the clarity and confidence that comes from truly understanding a company’s financial health. That’s the promise of mastering the equity return formula. We’ll walk you through each element, Net Income, Average Shareholders’ Equity, and offer a step-by-step calculation using realistic numbers. By the end of this guide, you’ll know how to interpret ROE, recognize common pitfalls, and see how it stacks up against other profitability ratios. Prepare to transform how you evaluate companies and seize investment opportunities like a pro.
What is Return on Equity ROE and how is it calculated?
Return on Equity (ROE) is a key financial metric that measures how effectively a company converts shareholders’ equity into net profit. In simple terms, it tells investors how much income a company generates for each dollar of equity capital invested by its owners. A higher ROE suggests that a firm is more efficient at generating profits from its equity base, which can be an indicator of strong management performance and competitive advantage.
To calculate ROE, you need two figures from a company’s financial statements: Net Income (the profit after all expenses, taxes, and interest) and Average Shareholders’ Equity (the average equity between the start and end of the period). The formula is straightforward, yet its implications are powerful. By dividing net income by average shareholders’ equity, you get a percentage value that can be compared across companies, industries, and time periods. This comparison helps investors identify firms that consistently deliver strong returns on the capital invested by their shareholders.
What is return on equity formula?
The return on equity formula is one of the simplest but most insightful calculations in financial analysis. It’s expressed as: ROE = Net Income / Average Shareholders’ Equity. Here, “Net Income” is the profit a company reports over a given period (usually a fiscal year), while “Average Shareholders’ Equity” represents the mean of equity at the beginning and end of that period.
Breaking down the formula, the numerator captures a company’s bottom-line profitability, and the denominator reflects the capital that shareholders have invested in the business, including retained earnings. When you apply the ROE formula, the result is a percentage that shows how much profit a company generates per dollar of equity. An ROE of 15% means the company earned $0.15 in profit for every $1 of shareholders’ equity invested, which can be compared against peers to gauge performance.
What is the formula for calculating SIP returns for equity funds?
Systematic Investment Plans (SIPs) allow investors to invest fixed amounts in mutual funds at regular intervals. Calculating returns for an SIP differs from calculating ROE, as SIP returns focus on time-weighted contributions rather than equity deployment. The standard SIP return formula estimates XIRR (extended internal rate of return), capturing the timing and size of each cash flow.
In practice, you compile your investment transactions (amounts and dates) and the current value of your investment, then apply an XIRR function in a spreadsheet or financial calculator. This yields an annualized return percentage, showing your compounded growth rate. While not part of the equity return formula for corporate analysis, understanding SIP returns helps individual investors evaluate their mutual fund performance effectively.
Explore our most popular stock fair value calculators to find opportunities where the market price is lower than the true value.
- Peter Lynch Fair Value – Combines growth with valuation using the PEG ratio. A favorite among growth investors.
- Buffett Intrinsic Value Calculator – Based on Warren Buffett’s long-term DCF approach to determine business value.
- Buffett Fair Value Model – Simplified version of his logic with margin of safety baked in.
- Graham & Dodd Fair Value – Uses conservative earnings-based valuation from classic value investing theory.
- Intrinsic vs. Extrinsic Value – Learn the core difference between what a company’s really worth and what others pay.
- Intrinsic Value Calculator – A general tool to estimate the true value of a stock, based on earnings potential.
- Fama-French Model – For advanced users: Quantifies expected return using size, value and market risk.
- Discount Rate Calculator – Helps estimate the proper rate to use in any DCF-based valuation model.
Importance of Return on Equity (ROE) in Financial Analysis
Return on Equity is critical because it directly measures the efficiency of a company in using shareholders’ capital to generate profits. Investors and analysts often use ROE to compare firms within the same industry, identifying those that consistently deliver superior returns. A strong ROE can signal a competitive edge, effective management, and sound capital allocation decisions.
Moreover, ROE acts as an indicator of growth potential. Companies with high and stable ROE typically have reinvestment opportunities yielding above-average returns, fueling growth in earnings and equity value over time. Conversely, a declining or low ROE may warn of operational inefficiencies, excessive debt, or poor profit margins. Thus, ROE is indispensable in screening stocks, constructing portfolios, and assessing management performance in financial analysis.
Components of ROE Formula
The two components of the equity return formula are Net Income and Average Shareholders’ Equity. Net Income is the profit figure reported on the income statement after deducting all expenses, taxes, and interest. It represents the company’s capacity to generate profit from its operations and non-operating activities.
Average Shareholders’ Equity, found on the balance sheet, represents the average of shareholders’ equity at the beginning and end of the period. It includes issued capital, retained earnings, and other reserves. By using the average rather than a single point in time, the formula accounts for fluctuations in equity during the period, offering a more accurate measure of capital deployed.
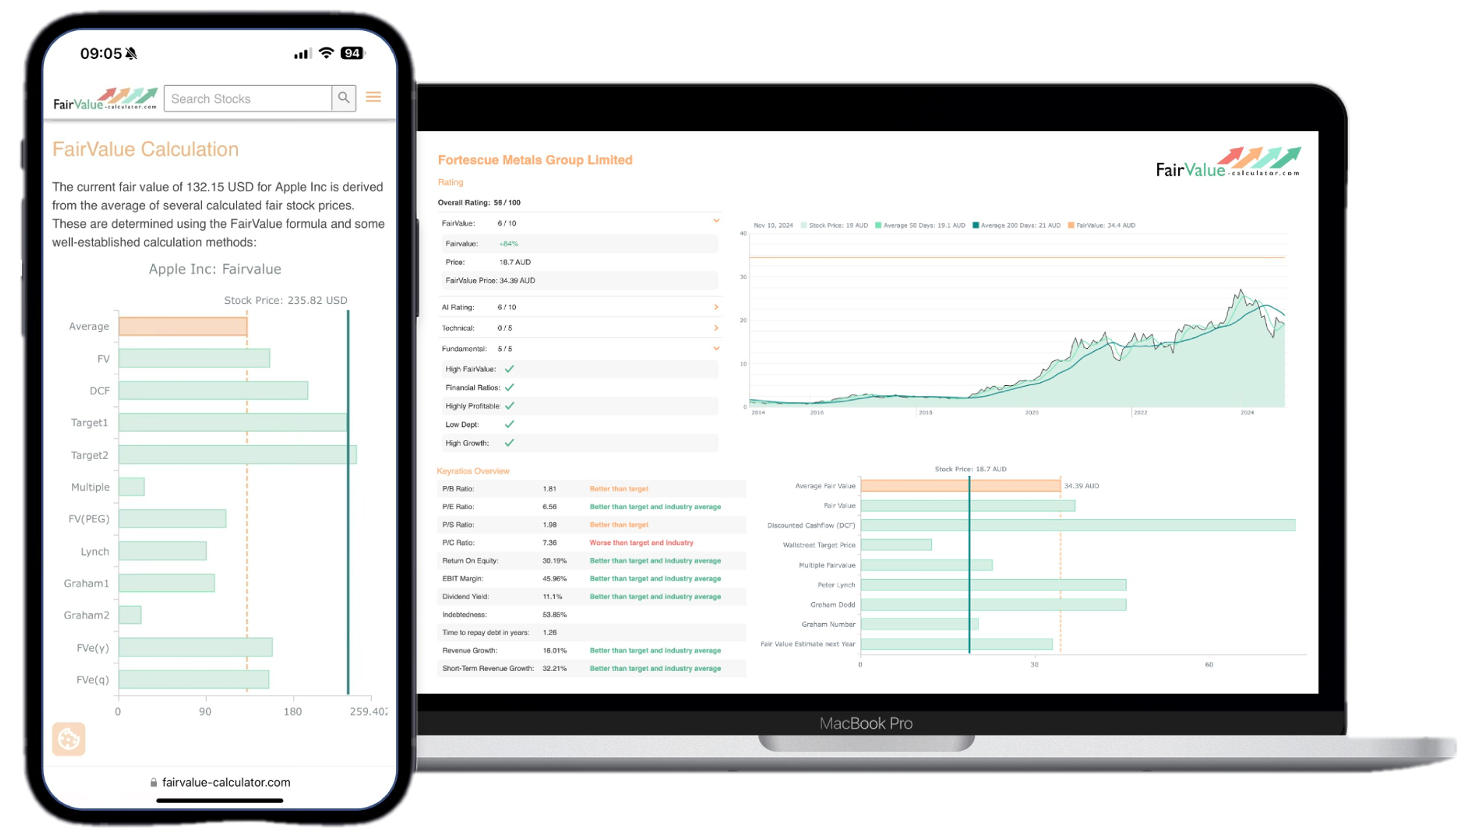
💡 Discover Powerful Investing Tools
Stop guessing – start investing with confidence. Our Fair Value Stock Calculators help you uncover hidden value in stocks using time-tested methods like Discounted Cash Flow (DCF), Benjamin Graham’s valuation principles, Peter Lynch’s PEG ratio, and our own AI-powered Super Fair Value formula. Designed for clarity, speed, and precision, these tools turn complex valuation models into simple, actionable insights – even for beginners.
Learn More About the Tools →Calculating Net Income for ROE Calculation
Net Income is the starting point for any ROE calculation. To determine net income, subtract operating expenses, interest costs, taxes, and any extraordinary items from total revenue. Companies report net income in the bottom line of their income statements, and it’s essential to use the figure after accounting for one-time gains or losses to ensure an apples-to-apples comparison over time.
Analysts should also consider adjustments for non-recurring items such as restructuring charges or large asset sales, which can distort true operating profitability. By normalizing net income, you capture a clearer picture of ongoing earnings power, leading to a more reliable ROE when examining efficiency in utilizing shareholders’ equity.
Understanding the Equity Return Formula
At its core, the equity return formula, ROE = Net Income / Average Shareholders’ Equity, captures how effectively management turns shareholder investments into profits. Net income reflects operational performance, while equity conveys the available capital base. ROE ties these together, revealing the return on each dollar of equity capital claims.
When unpacking this formula, one must appreciate that ROE can be influenced by profit margins, asset turnover, and financial leverage. Higher margins and turnover drive net income relative to equity, boosting ROE, while leverage can amplify returns (and risk). Therefore, breaking ROE into its drivers, via the DuPont analysis, is an advanced way to understand the underlying sources of return and risk.


Interpreting ROE Results
Interpreting ROE involves benchmarking against peer companies, industry averages, and historical performance. Generally, an ROE between 15% and 20% is considered healthy for most industries, signaling profitable use of equity. Companies with ROE persistently above industry norms often enjoy competitive advantages such as brand strength, cost leadership, or high barriers to entry.
However, a very high ROE (e.g., above 25%) may indicate excessive leverage rather than pure operational efficiency. Conversely, a low or declining ROE can flag deteriorating profitability, capital inefficiencies, or sector-wide headwinds. Investors should always assess the quality and sustainability of ROE by examining cash flows, debt levels, and capital investments alongside the raw ROE figure.
Common Pitfalls to Avoid in ROE Analysis
One common pitfall is ignoring the impact of leverage. Since ROE uses equity in the denominator, companies can inflate ROE by taking on excessive debt. A high ROE driven mainly by leverage may pose solvency risks if earnings falter. Always review the debt-to-equity ratio alongside ROE to gauge risk-adjusted returns.
Another mistake is failing to normalize net income for one-time items such as asset write-downs or extraordinary gains. Such events can spike or depress ROE artificially, leading to misleading conclusions. Analysts should adjust net income for these items to capture the recurring earning power that drives sustainable ROE.
Tips for Effective Utilization of ROE in Investment Decisions
First, use ROE in conjunction with other profitability ratios like Return on Assets (ROA) and Return on Invested Capital (ROIC). While ROE focuses on equity, ROA and ROIC provide broader views of asset and capital efficiency, offering a balanced perspective on performance. This multi-metric approach helps identify companies excelling across various efficiency dimensions.
Second, apply DuPont analysis to decompose ROE into profit margin, asset turnover, and leverage components. By understanding which lever is driving ROE, higher margins, better turnover, or increased leverage, you can assess the sustainability of returns and uncover opportunities or red flags hidden in aggregate ROE figures.
Conclusion: Mastering ROE for Informed Investing
Mastering the equity return formula empowers you to evaluate a company’s ability to turn shareholder capital into profits effectively. By understanding ROE’s components, net income and average equity, you can interpret performance across time and against peers, always mindful of leverage and one-time items.
Equipped with expert tips and common pitfalls to avoid, you’re ready to integrate ROE into your investment toolkit. Try an online ROE calculator today to practice with real data—this small step can transform your stock analysis and lead you toward more confident, informed investing decisions.
The Significance of Return on Equity (ROE)
Return on Equity (ROE) remains one of the most significant profitability ratios, directly linking a company’s net earnings to shareholder capital. It offers investors an immediate gauge of how well management utilizes funds contributed by equity holders to generate profits. Companies with sustained high ROE typically showcase strong business models, efficient operations, and the ability to reinvest earnings for growth.
By focusing on ROE in your stock screening and financial analysis, you concentrate on firms that not only grow sales but also manage costs and capital effectively. This emphasis on return generation makes ROE a cornerstone metric in both fundamental analysis and portfolio construction, guiding investors toward companies with durable competitive advantages and attractive profit potential.
Components of the Equity Return Formula
The equity return formula hinges on two main elements: net income and average shareholders’ equity. Net income captures the bottom-line profit figure, reflecting revenue minus all operational and non-operational expenses, interest, and taxes. It’s the true measure of a company’s profitability over a specific period.
Average shareholders’ equity represents the capital base that equity investors have supplied to the company, including common stock, retained earnings, and reserves. Averaging the beginning and ending equity balances smooths out fluctuations and provides a more accurate denominator for the ratio. Together, these components form the foundation of ROE, linking profitability to invested capital.
Common Pitfalls in ROE Analysis
Relying solely on ROE without context can lead to misinterpretation. High ROE driven by excessive leverage may mask underlying risks; always check debt levels and interest coverage ratios. Similarly, one-time gains or losses in net income can distort ROE figures; normalize earnings to reflect recurring operating performance.
An additional pitfall is ignoring business cycles and industry norms. Industries with heavy asset needs often have naturally lower ROE, while asset-light sectors can boast higher figures. Benchmark within the same sector and adjust for cyclical peaks or troughs to avoid overestimating or underestimating a company’s true efficiency in using equity capital.
What is the Equity Return Formula’s primary purpose? The Equity Return Formula calculates return on equity (ROE) to evaluate a company’s profitability relative to its equity investment.
Why is it important to consider debt levels when analyzing ROE? It is crucial to assess debt levels as high ROEs driven by excessive leverage can obscure potential risks associated with the company’s capital structure.
How can one-time gains or losses impact the interpretation of ROE figures?One-time gains or losses in net income can distort ROE figures, necessitating the normalization of earnings to reflect the company’s recurring operational performance.
What is a key factor to avoid when analyzing ROE in different industries? It is essential to consider business cycles and industry norms to avoid overestimating or underestimating a company’s true efficiency in using equity capital, especially when comparing across sectors.
How can companies ensure accurate ROE analysis within their industry? Companies can benchmark their ROE within the same industry, adjusting for cyclical peaks or troughs, to obtain a more precise evaluation of their performance using equity capital.