In the labyrinth of financial investments, understanding the true worth of a company can seem as elusive as chasing shadows. Yet, for those who seek to unlock fair value, mastering comparables such as Price-to-Earnings (P/E), Price-to-Sales (P/S), and Enterprise Value-to-EBITDA (EV/EBITDA) ratios is akin to discovering a map that guides you through the fog. These metrics are not just numbers; they are powerful tools that, when wielded judiciously, reveal the hidden potential of companies and provide the clarity needed to make informed investment decisions.
To truly harness the power of these ratios, one must learn to navigate the intricacies of how to use comparables or peer-multiples to estimate fair value effectively. This involves a deep dive into the financial health and market position of companies, understanding industry benchmarks, and recognizing market trends. Imagine being able to compare apples to apples in the world of finance, meticulously aligning companies based on their sector performance and growth potential. This approach not only demystifies complex financial evaluations but also empowers investors to make strategic choices rooted in intelligence rather than speculation.

Understanding Price-to-Earnings (P/E) Ratio
The Price-to-Earnings (P/E) ratio is one of the most widely used valuation metrics in equity analysis. It measures the relationship between a company’s market price per share and its earnings per share (EPS). At its core, P/E tells investors how much they are willing to pay for each dollar of reported profit. A high P/E suggests that the market expects strong growth in the future, whereas a low P/E may indicate undervaluation or potential issues in sustaining earnings.
When we ask “How to use comparables / peer-multiples (P/E, P/S, EV/EBITDA) to estimate fair value?” the P/E ratio often serves as the starting point. By comparing a target company’s P/E against the average P/E of peers in the same industry, investors can identify whether the stock is trading at a premium or discount. However, it’s vital to adjust for growth rates, capital structures, and one-time earnings events. A superficial P/E comparison might mislead if, for instance, one firm has a cyclical business or carries excess debt.
In practice, a normalized P/E, adjusted for extraordinary items and one-off gains, provides a cleaner basis for comparison. Coupled with future earnings estimates, this normalized ratio offers insights into the sustainability of earnings. Ultimately, mastering the P/E ratio empowers investors to filter through market noise and focus on the intrinsic earning power of companies.
Mastering Price-to-Sales (P/S) Ratio Analysis
The Price-to-Sales (P/S) ratio examines a company’s market capitalization relative to its total revenue over a specified period. Unlike P/E, which hinges on profitability, the P/S ratio is invaluable for firms not yet profitable or those with volatile earnings. It provides a revenue-based valuation benchmark, allowing investors to gauge how the market values every dollar of sales generated.
By analyzing the P/S ratio, investors can navigate growth-oriented sectors like technology, biotech, and start-ups, where earnings may be negative or inconsistent. A lower P/S suggests that a company’s shares might be undervalued relative to its sales, while a higher P/S could reflect strong growth expectations or pricing power in the marketplace.
When comparing P/S multiples among peers, it’s crucial to account for differences in gross margins and scalability. Two companies with identical P/S ratios may diverge significantly in profitability if one operates with leaner costs or superior margins. Therefore, investors often complement P/S analysis with margin metrics to get a fuller picture of revenue quality. Mastering P/S ratio analysis thus involves blending revenue comparisons with profitability indicators to derive a balanced assessment of fair value.
Unveiling Enterprise Value-to-EBITDA (EV/EBITDA) Ratio Calculation
Enterprise Value-to-EBITDA (EV/EBITDA) is a leverage-neutral multiple that relates the total enterprise value (EV) to a company’s earnings before interest, taxes, depreciation, and amortization (EBITDA). EV includes market capitalization plus net debt, thus providing a holistic view of a firm’s valuation irrespective of its capital structure.
EV/EBITDA is particularly favored in industries with significant depreciation and amortization charges, like heavy manufacturing and utilities—because it focuses on operating cash flows rather than accounting profits. A lower EV/EBITDA implies that a company might be undervalued relative to its peers, whereas a higher multiple could indicate premium pricing or robust growth prospects. Calculating EV/EBITDA accurately requires careful treatment of off‐balance‐sheet leases, minority interests, and unusual items to ensure a true apples‐to‐apples comparison.
Explore our most popular stock fair value calculators to find opportunities where the market price is lower than the true value.
- Peter Lynch Fair Value – Combines growth with valuation using the PEG ratio. A favorite among growth investors.
- Buffett Intrinsic Value Calculator – Based on Warren Buffett’s long-term DCF approach to determine business value.
- Buffett Fair Value Model – Simplified version of his logic with margin of safety baked in.
- Graham & Dodd Fair Value – Uses conservative earnings-based valuation from classic value investing theory.
- Intrinsic vs. Extrinsic Value – Learn the core difference between what a company’s really worth and what others pay.
- Intrinsic Value Calculator – A general tool to estimate the true value of a stock, based on earnings potential.
- Fama-French Model – For advanced users: Quantifies expected return using size, value and market risk.
- Discount Rate Calculator – Helps estimate the proper rate to use in any DCF-based valuation model.
Importance of Using Comparable Companies for Analysis
Using comparable companies, often called “comps”, is the backbone of relative valuation. By benchmarking a target firm against peers with similar business models, growth trajectories, and risk profiles, investors can derive market‐driven fair value estimates. This peer‐multiples approach mitigates the uncertainty inherent in standalone forecasts by anchoring valuations to observable market data.
However, selecting truly comparable firms demands scrutiny. Differences in geographic presence, customer mix, and regulatory environments can skew multiples. Thus, successful comparables analysis rests on rigorous screening and judicious adjustments for variations in size, margin structures, and growth expectations. When done correctly, this process enriches traditional discounted cash flow models by cross‐checking valuations against market sentiment.
Conducting a Deep Dive into Financial Health Metrics
Diving into financial health metrics complements peer‐multiples by revealing underlying strengths and vulnerabilities. Key ratios, such as debt‐to‐equity, current ratio, interest coverage, and free cash flow margin, offer a multidimensional view of a company’s resilience and operational efficiency.
Analyzing these metrics in tandem with P/E, P/S, and EV/EBITDA ensures that peers are not only similar in revenue or earnings but also in balance sheet robustness. For instance, two companies with identical EV/EBITDA multiples may carry vastly different debt loads. By overlaying liquidity and solvency ratios, investors avoid value traps and enhance the accuracy of fair value estimations.
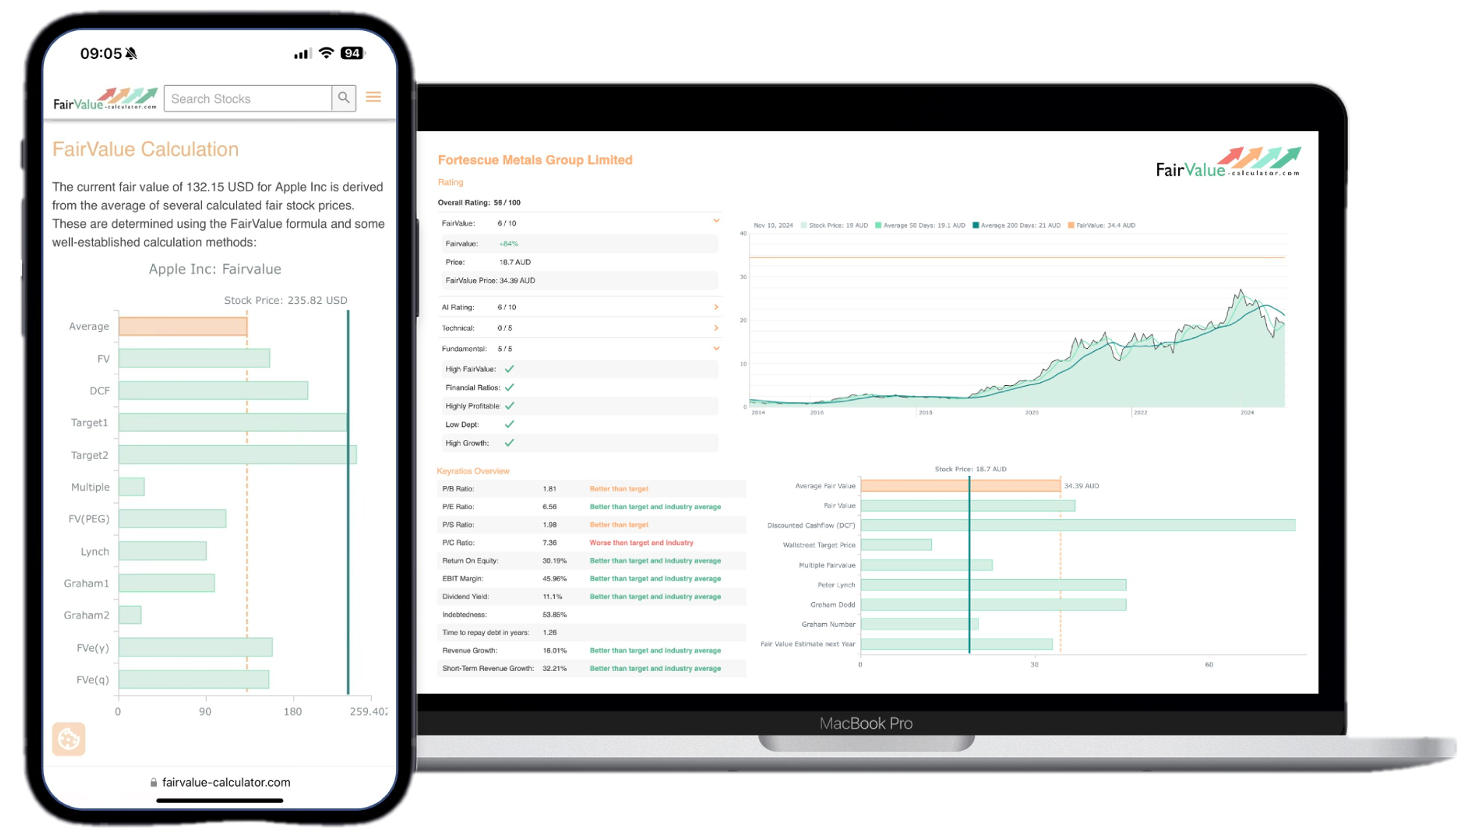
💡 Discover Powerful Investing Tools
Stop guessing – start investing with confidence. Our Fair Value Stock Calculators help you uncover hidden value in stocks using time-tested methods like Discounted Cash Flow (DCF), Benjamin Graham’s valuation principles, Peter Lynch’s PEG ratio, and our own AI-powered Super Fair Value formula. Designed for clarity, speed, and precision, these tools turn complex valuation models into simple, actionable insights – even for beginners.
Learn More About the Tools →Recognizing Industry Benchmarks for Fair Value Estimation
Industry benchmarks serve as vital reference points when estimating fair value. Each sector has characteristic multiples influenced by growth rates, capital intensity, and competitive dynamics. For example, tech companies often trade at higher P/S and EV/EBITDA multiples than utilities due to rapid revenue expansion and lower fixed costs.
By collating historical median and quartile multiples for an industry, investors establish context for current valuations. Deviations from these benchmarks can highlight mispricing opportunities or signal structural shifts in the business environment. Thus, integrating industry benchmarks into comparables analysis refines fair value estimations by aligning them with long‐term market norms.
Identifying Market Trends and Their Impact on Valuation
Market trends, such as interest rate fluctuations, commodity cycles, and technology adoption, can profoundly influence valuation multiples. Rising rates, for instance, tend to compress P/E and EV/EBITDA multiples by increasing discount rates and borrowing costs. Conversely, disruptive innovations can expand multiples as investors price in future growth potential.
Monitoring these trends helps investors adjust comparables analysis in real time. When peers collectively trade at stretched multiples due to a bullish sentiment, anchoring fair value to outdated benchmarks can mislead. Staying attuned to macroeconomic indicators and sector‐specific catalysts ensures that peer‐multiples reflect current market realities rather than historical norms.

Aligning Companies Based on Sector Performance
Aligning companies effectively means grouping peers not only by industry but also by sub‐sector performance drivers. For instance, within the broader technology sector, software companies generally exhibit higher P/S multiples than hardware manufacturers due to subscription models and recurring revenue streams.
By segmenting peers according to growth profiles, margin structures, and capital intensity, investors improve the precision of their comparables. This granular alignment reduces the noise from heterogenous business models and yields more meaningful multiple comparisons, leading to sharper fair value estimations.
Demystifying Complex Financial Evaluations
Complex financial evaluations often intimidate investors with jargon and intricate calculations. However, by breaking down valuation into peer‐multiples like P/E, P/S, and EV/EBITDA and supplementing with key health metrics, the process becomes intuitive. Each ratio examines a different facet of performance, profitability, revenue generation, and cash flow, providing a comprehensive valuation toolkit.
Demystification also involves transparency in assumptions and adjustments. Documenting how extraordinary items or accounting differences are normalized ensures that the comparables analysis stands up to scrutiny. With a clear, step‐by‐step approach, even sophisticated evaluations become accessible to investors at all experience levels.
Making Strategic Investment Decisions Rooted in Intelligence
Ultimately, the goal of any valuation exercise is to inform strategic investment decisions. By mastering peer‐multiples and understanding how to use comparables / peer-multiples (P/E, P/S, EV/EBITDA) to estimate fair value, investors ground their choices in empirical data rather than guesswork. This disciplined methodology helps identify undervalued opportunities and avoid overpriced traps.
Coupling relative valuation with qualitative assessments, management quality, competitive positioning, and innovation pipeline, enables a holistic investment thesis. When investors combine rigorous peer‐multiples analysis with forward‐looking business insights, they unlock the true potential of companies and achieve sustainable, long‐term returns.
Conclusion
Mastering comparables through P/E, P/S, and EV/EBITDA ratios transforms valuation from art into a systematic process. By anchoring estimates to market‐driven multiples and reinforcing them with financial health metrics, investors achieve clarity in fair value assessment.
This structured approach demystifies complex evaluations and guides strategic investment decisions rooted in empirical intelligence. Embrace these tools, and you’ll navigate the investment landscape with precision and confidence.