In the high-stakes world of AI investment, two titans often dominate conversations: Nvidia and Broadcom. While Nvidia’s groundbreaking work in GPUs has made it a household name among tech investors, Broadcom is often overlooked as a formidable contender. But could this be a mistake? In our Broadcom stock analysis, we delve into why this seemingly underestimated tech giant may warrant a closer look. With Broadcom’s P/E ratio soaring above 100, and a ROE of 19%, some investors might be quick to dismiss it. However, beneath the surface lies a company with its own unique strengths and strategic advantages that set it apart from its better-known rival.
While Nvidia boasts an impressive EBIT margin of 65% and short-term revenue growth exceeding 120%, Broadcom holds its ground with a solid 27% EBIT margin and a steady 20% revenue increase. These numbers paint a picture not just of competition, but of two distinct paths to success in the AI landscape. It’s easy to categorize Broadcom merely as an alternative, but doing so misses the nuances of its role in custom chip solutions. Join us as we explore these disparities and more, in our quest to determine whether Broadcom truly presents a viable challenge to Nvidia’s dominance, or if it’s playing an entirely different game altogether.
Comparative Analysis of Nvidia and Broadcom’s Financial Performance
Nvidia vs Broadcom showcases two very different financial profiles in the AI stocks arena. Nvidia’s P/E ratio sits at about 57, reflecting high growth expectations, while Broadcom’s P/E exceeds 100, suggested staggering aggressive valuation. On profitability, Nvidia delivers a staggering ROE north of 115%, contrasted with Broadcom’s solid 19%. EBIT margins also diverge sharply: Nvidia at roughly 65% versus Broadcom’s 27%.
This comparative analysis reveals that Nvidia commands exceptional growth and margin leadership, whereas Broadcom offers moderate but steady performance. Both companies appear as overvalued stocks versus fair value models: Broadcom is nearly 50% overvalued, Nvidia around 45%. Such a gap underscores the importance of tools like a fair value calculator for investors seeking clarity on entry points.
Evaluating Broadcom’s Unique Strengths in the AI Market
Broadcom’s footprint in the AI ecosystem extends well beyond commodity chips. Its strong relationships with hyperscale datacenters and telecom carriers enable custom silicon solutions tailored to specific workloads. This customer-centric model helps Broadcom lock in multi-year contracts, providing revenue stability in a cyclical industry.
Moreover, Broadcom’s diversified portfolio, spanning networking, storage, and wireless, reduces reliance on any single end market. In contrast, Nvidia’s focus remains heavily weighted toward GPUs. For those seeking an alternative play on AI infrastructure, Broadcom stock analysis reveals a distinctive strategy that can complement a portfolio centered on high-flying GPU narratives.
Understanding the Significance of Broadcom’s P/E Ratio Above 0
A P/E ratio north of 100 places Broadcom firmly in the high-expectation bucket. Such valuation suggests that investors are pricing in sustained growth, despite the company’s more modest revenue trajectory. In a sector littered with overvalued stocks, Broadcom’s stretched multiple demands rigorous scrutiny.
By comparison, Nvidia’s P/E of 57 still reflects lofty forecasts, but is relatively less aggressive. For retail investors, the lesson in this Nvidia vs Broadcom debate is that multiples alone can mislead without context. Pairing a fair value calculator with deeper fundamental analysis helps identify if Broadcom’s premium is truly justified by its custom-chip strategy and client demand.
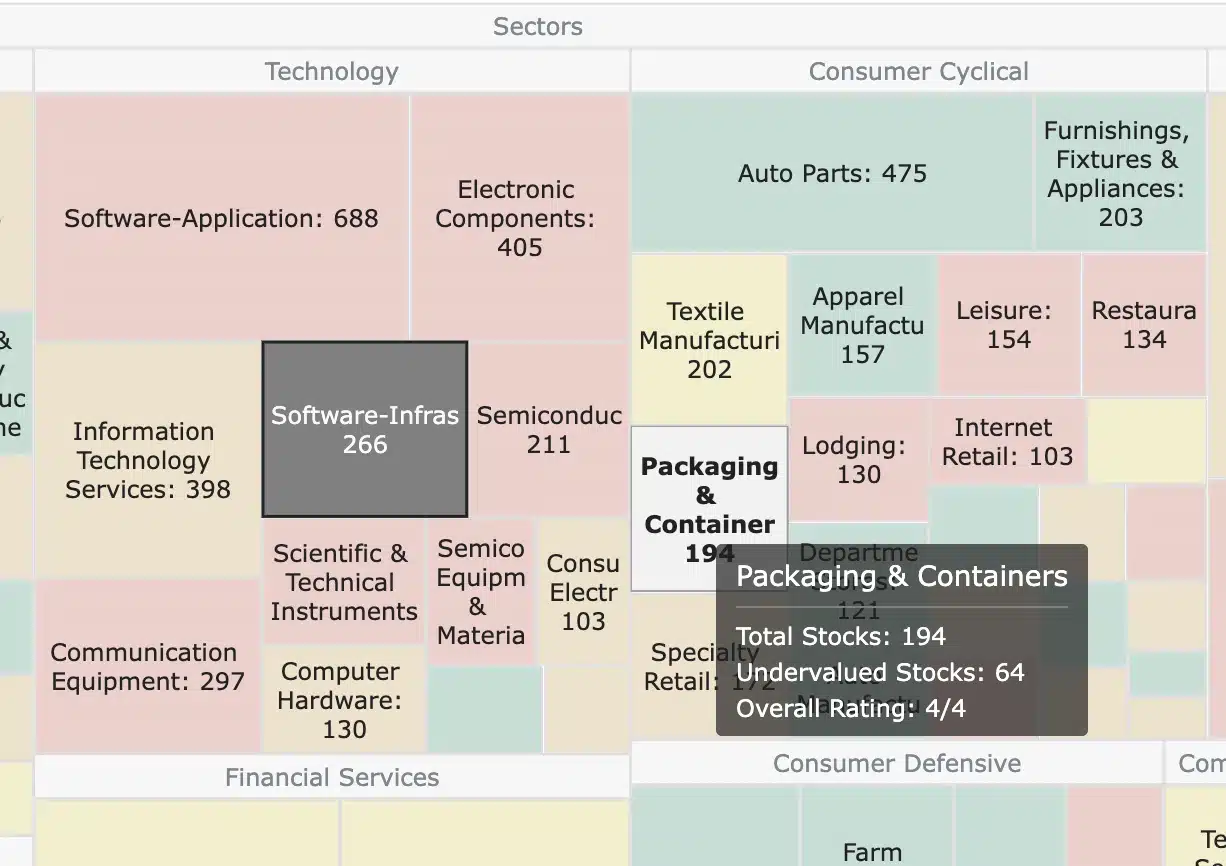
Explore our most popular stock fair value calculators to find opportunities where the market price is lower than the true value.
- Peter Lynch Fair Value – Combines growth with valuation using the PEG ratio. A favorite among growth investors.
- Buffett Intrinsic Value Calculator – Based on Warren Buffett’s long-term DCF approach to determine business value.
- Buffett Fair Value Model – Simplified version of his logic with margin of safety baked in.
- Graham & Dodd Fair Value – Uses conservative earnings-based valuation from classic value investing theory.
- Intrinsic vs. Extrinsic Value – Learn the core difference between what a company’s really worth and what others pay.
- Intrinsic Value Calculator – A general tool to estimate the true value of a stock, based on earnings potential.
- Fama-French Model – For advanced users: Quantifies expected return using size, value and market risk.
- Discount Rate Calculator – Helps estimate the proper rate to use in any DCF-based valuation model.
Analyzing Broadcom’s ROE of %: A Closer Look
Broadcom’s return on equity (ROE) of about 19% signals solid capital efficiency but pales beside Nvidia’s north-of-115% performance. This substantial gap illustrates how Nvidia leverages assets to generate outsized earnings, thanks to its dominant GPU franchise and high-margin software offerings.
Yet Broadcom’s ROE should not be dismissed outright. A near-20% ROE still exceeds many traditional semiconductor peers. Combined with a stable cash flow profile, Broadcom’s performance highlights a more defensive growth model. Investors weighing AI stocks must ask: do I prize explosive upside, or steadier returns with less volatility?
Unpacking Nvidia’s EBIT Margin of % and Broadcom’s % Margin
Nvidia’s EBIT margin of roughly 65% is virtually unmatched in semis, driven by premium GPU pricing and efficient R&D scaling. Such margins fuel massive free cash flow, enabling robust cycle, buybacks and further software investments. It’s a virtuous cycle reinforcing Nvidia’s leadership in AI acceleration.
By contrast, Broadcom’s 27% EBIT margin, while healthy, reflects its broader product mix and competitive pressures in networking and storage. Though it can’t match Nvidia’s profitability, Broadcom’s diversified offerings dampen the cyclicality inherent in any single segment, offering investors a different risk–return profile within the AI stocks space.
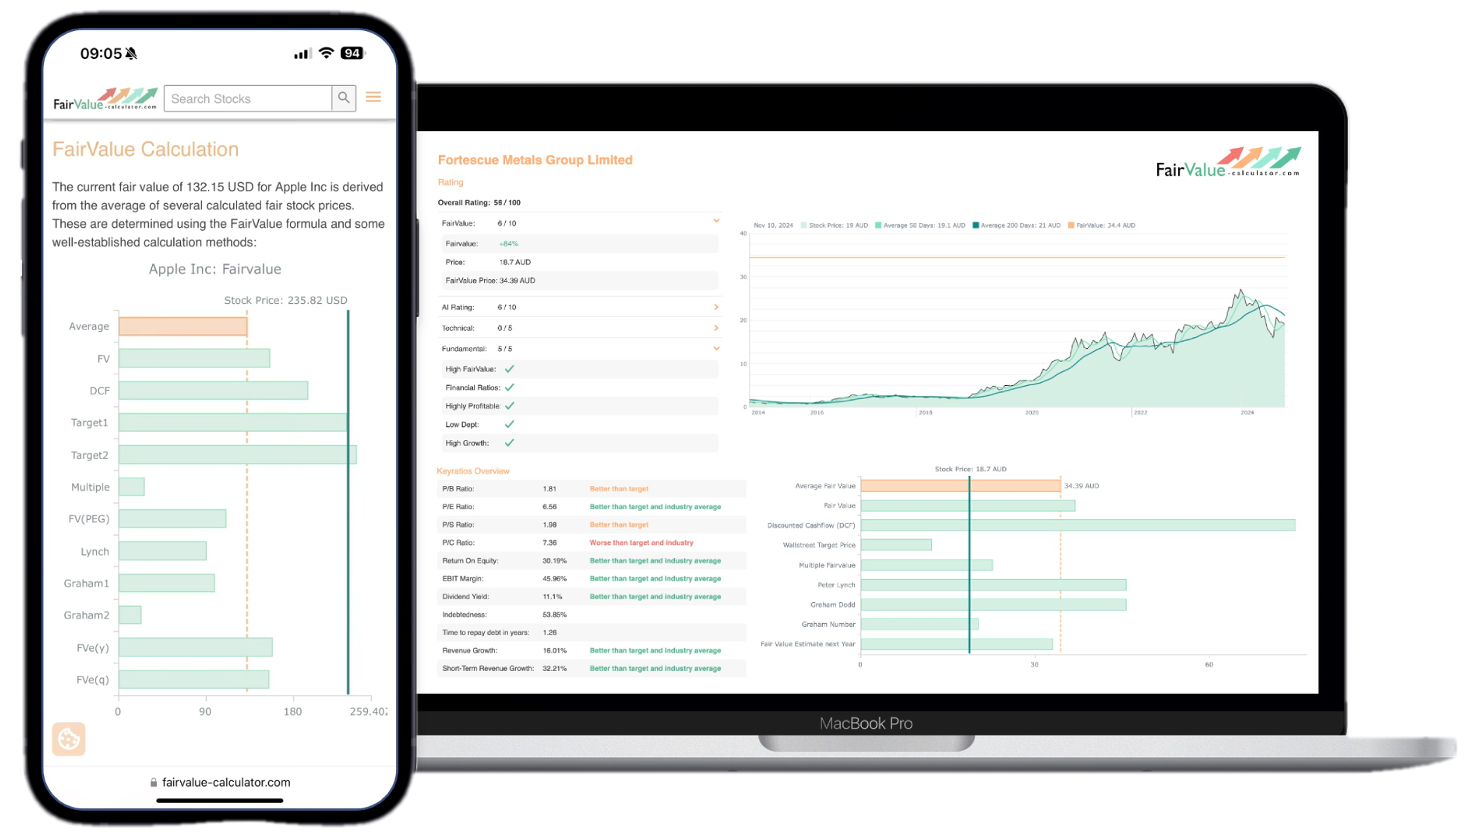
💡 Discover Powerful Investing Tools
Stop guessing – start investing with confidence. Our Fair Value Stock Calculators help you uncover hidden value in stocks using time-tested methods like Discounted Cash Flow (DCF), Benjamin Graham’s valuation principles, Peter Lynch’s PEG ratio, and our own AI-powered Super Fair Value formula. Designed for clarity, speed, and precision, these tools turn complex valuation models into simple, actionable insights – even for beginners.
Learn More About the Tools →Delving into the Short-Term Revenue Growth of Nvidia and Broadcom
Nvidia’s recent top-line surge, over 120% year-over-year, epitomizes the AI boom. Demand for its H100 GPUs skyrocketed across data centers, pushing sales into hyper-growth mode. This explosive momentum underpins much of the bullish case, yet also drives its heavy overvaluation.
Broadcom, by comparison, posted around 20% short-term revenue growth, respectable for a mature semiconductor giant. Its custom-chip contracts and networking acquisitions fueled steady gains. For investors wary of frothy valuations, Broadcom’s more measured growth trajectory may offer a less dramatic but more sustainable path.
The Role of Custom Chip Solutions in Broadcom’s Strategy
Custom silicon lies at the heart of Broadcom’s differentiation. By co-designing chips with major cloud providers and telecom operators, Broadcom embeds itself deep into clients’ long-term roadmaps, creating high switching costs and predictable revenue streams.
This bespoke approach contrasts with Nvidia’s off-the-shelf GPU sales model. While Nvidia captures broad AI training and inference demand, Broadcom secures specialized workloads, from network processing to storage acceleration. Such a dual-track industry structure highlights how both companies can thrive without stepping on each other’s toes.

Broadcom vs. Nvidia: Different Paths to Success in the AI Landscape
In the Nvidia vs Broadcom narrative, Nvidia reigns as the AI compute leader with unmatched GPU dominance. Its high-margin, high-growth model appeals to investors chasing the next decade of AI acceleration. Yet, this comes with high valuation risk.
Broadcom, on the other hand, carves out its niche through custom solutions and diversified offerings. Its approach trades off some upside for revenue resilience and client stickiness. For those building a balanced AI stocks portfolio, combining both strategies could harness growth while tempering volatility.
Can Broadcom be Considered a Viable Challenger to Nvidia?
While Broadcom is often branded as “the next Nvidia,” the reality is more nuanced. Broadcom competes in adjacent segments, networking, storage, wireless, rather than the pure GPU domain. Its strengths lie in custom chips and long-term contracts, not broad-based AI compute sales.
Thus, Broadcom isn’t a direct challenger but rather an alternative AI infrastructure play. Investors seeking diversified exposure to the AI revolution might view Broadcom stock analysis as a complementary bet alongside GPU-centric names, rather than a one-for-one replacement for Nvidia’s explosive growth story.
Conclusion: The Unveiling of Broadcom’s Potential in the Tech Market
Ultimately, Broadcom is not the better Nvidia, each pursues different strategies within the AI ecosystem. Nvidia’s GPU hegemony delivers breathtaking margins and growth, whereas Broadcom leverages custom solutions to build durable, contract-backed revenue streams.
Both names trade at premium valuations, underscoring the importance of rigorous financial analysis and tools like a fair value calculator. For smarter stock comparisons, consider using Fairvalue-Calculator.com to gauge when AI stocks like Nvidia and Broadcom truly offer compelling entry points.