Terminal value represents one of the most critical yet frequently misunderstood components of discounted cash flow valuation, often accounting for 60% to 80% of a company’s total enterprise value in DCF models. This metric captures the present value of all cash flows beyond the explicit forecast period, recognizing that businesses don’t simply cease to exist after five or ten years of detailed projections. Understanding how to properly calculate terminal value separates rigorous financial analysis from amateur valuation attempts that produce misleading results and poor investment decisions.
The concept addresses a fundamental challenge in business valuation: while analysts can reasonably forecast detailed financial performance for limited periods, projecting specific cash flows decades into the future becomes increasingly speculative and unreliable. Terminal value provides an elegant mathematical solution by using simplified assumptions about long-term growth and profitability to estimate the value of all those distant future cash flows without requiring detailed year-by-year projections stretching indefinitely forward.
The Two Primary Terminal Value Methods
The perpetuity growth method, also called the Gordon Growth Model approach, calculates terminal value by assuming the company continues generating cash flows indefinitely at a constant growth rate. This method proves particularly suitable for mature businesses with stable competitive positions, predictable cash flows, and growth rates that should track long-term economic expansion. The formula takes the form: Terminal Value = Final Year Cash Flow × (1 + Growth Rate) / (Discount Rate – Growth Rate), creating a simple yet powerful calculation that converts a single year’s cash flow into the present value of all future periods.
The exit multiple method estimates terminal value by applying a valuation multiple to a final year financial metric, typically EBITDA, revenue, or earnings. This approach assumes that at the end of the forecast period, the business could be sold for a price reflecting market multiples paid for comparable companies. The formula appears straightforward: Terminal Value = Final Year Metric × Selected Multiple, though selecting appropriate multiples requires careful consideration of industry norms, company-specific factors, and market conditions likely to prevail at the terminal year.
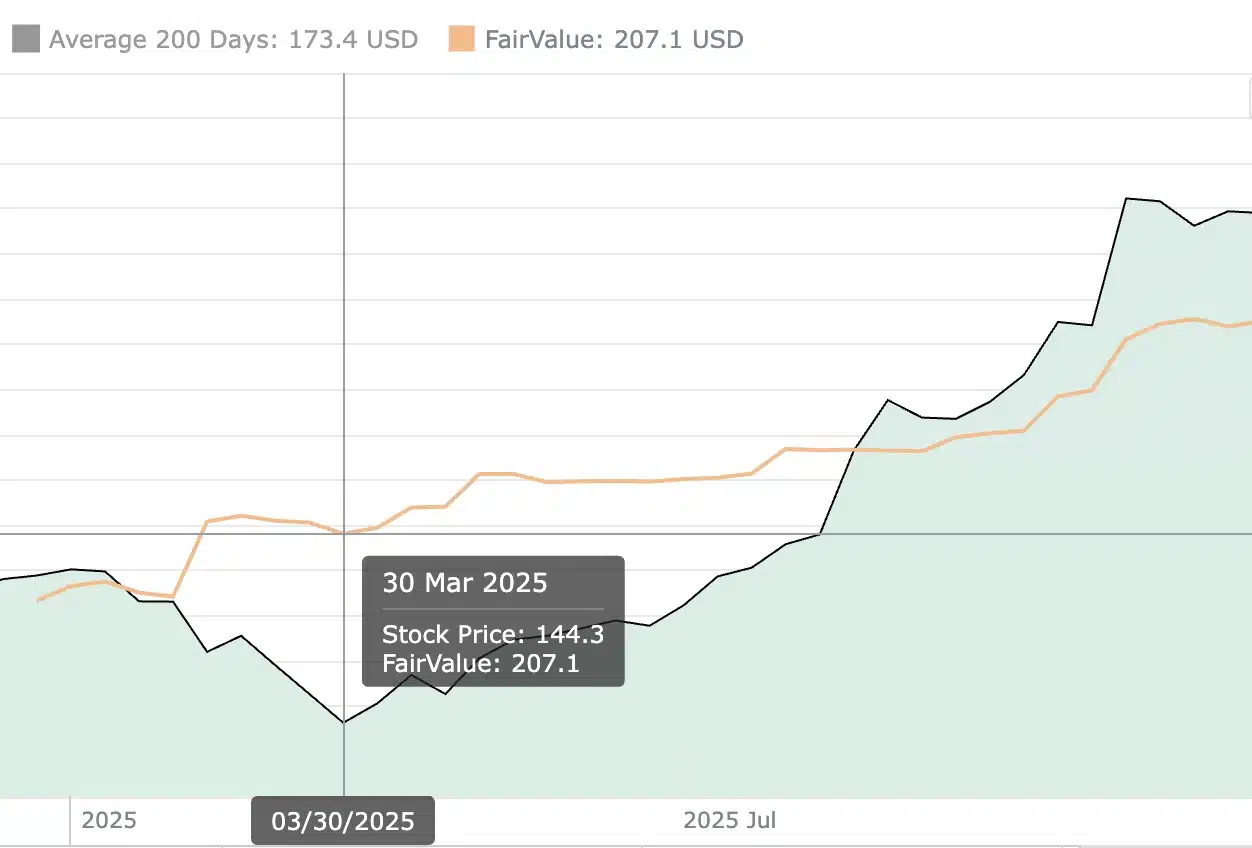
Explore our most popular stock fair value calculators to find opportunities where the market price is lower than the true value.
- Peter Lynch Fair Value – Combines growth with valuation using the PEG ratio. A favorite among growth investors.
- Buffett Intrinsic Value Calculator – Based on Warren Buffett’s long-term DCF approach to determine business value.
- Buffett Fair Value Model – Simplified version of his logic with margin of safety baked in.
- Graham & Dodd Fair Value – Uses conservative earnings-based valuation from classic value investing theory.
- Intrinsic vs. Extrinsic Value – Learn the core difference between what a company’s really worth and what others pay.
- Intrinsic Value Calculator – A general tool to estimate the true value of a stock, based on earnings potential.
- Fama-French Model – For advanced users: Quantifies expected return using size, value and market risk.
- Discount Rate Calculator – Helps estimate the proper rate to use in any DCF-based valuation model.
Both methods possess strengths and weaknesses that make them more or less suitable depending on company characteristics and analyst preferences. The perpetuity growth approach rests on more explicit assumptions about long-term growth and avoids the circular reasoning that can occur when using multiples derived from DCF valuations. However, it proves highly sensitive to growth rate assumptions, where small changes dramatically impact calculated values. The exit multiple method provides market-grounded valuations less dependent on distant-future growth assumptions, though it requires judgment about appropriate multiples and implicitly incorporates market sentiment that might not reflect fundamental value.
Applying the Perpetuity Growth Method
Calculating terminal value using perpetuity growth begins with identifying the final year’s free cash flow from your explicit forecast period. If your DCF model projects five years of detailed cash flows ending with $50 million in year five, this becomes your starting point. You then select a perpetual growth rate representing the constant annual increase you expect indefinitely into the future. This rate should reflect long-term GDP growth, industry expansion rates, and company-specific factors, typically ranging from 2% to 4% for mature businesses in developed economies.
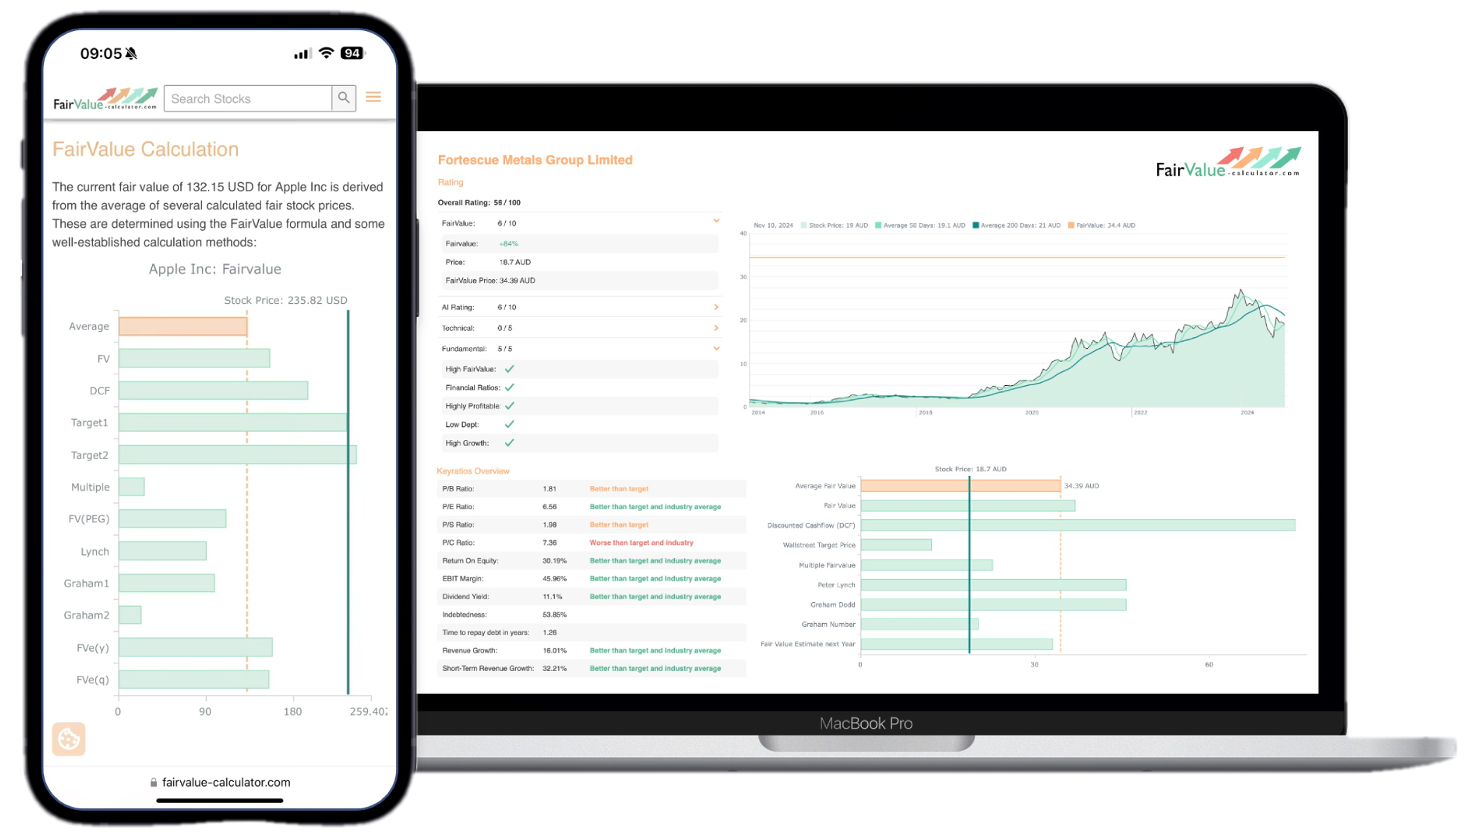
💡 Discover Powerful Investing Tools
Stop guessing – start investing with confidence. Our Fair Value Stock Calculators help you uncover hidden value in stocks using time-tested methods like Discounted Cash Flow (DCF), Benjamin Graham’s valuation principles, Peter Lynch’s PEG ratio, and our own AI-powered Super Fair Value formula. Designed for clarity, speed, and precision, these tools turn complex valuation models into simple, actionable insights – even for beginners.
Learn More About the Tools →Consider a practical example where a manufacturing company generates $50 million free cash flow in the final projection year, with expectations for 3% perpetual growth and a 10% discount rate reflecting the business risk. Applying the perpetuity growth formula produces: Terminal Value = $50 million × (1.03) / (0.10 – 0.03) = $51.5 million / 0.07 = $735.7 million. This figure represents the present value at the end of year five of all subsequent cash flows growing at 3% annually forever.
To incorporate this terminal value into your complete DCF model, you must discount it back to present value using the same discount rate applied to the explicit forecast period cash flows. If using a 10% discount rate, the $735.7 million terminal value gets divided by (1.10)^5, yielding a present value of approximately $456.8 million. This amount then combines with the present value of the five-year explicit forecast cash flows to determine total enterprise value.

The perpetuity growth rate requires particularly careful consideration, as the formula becomes mathematically invalid if the growth rate equals or exceeds the discount rate. Economic logic supports this restriction: no company can grow faster than the overall economy indefinitely without eventually becoming larger than the entire economic system. Conservative analysts often use growth rates at or below long-term GDP growth of 2% to 3%, while more aggressive assumptions might reach 4% to 5% for companies in expanding industries with sustainable competitive advantages, though rates above 4% require strong justification.
Understanding the Exit Multiple Approach
The exit multiple method begins similarly by identifying final year financial metrics from your forecast period, though focusing on earnings measures rather than cash flow. If year five projects $100 million in EBITDA, $60 million in EBIT, or $40 million in net income, you select the metric most relevant for your industry and valuation purpose. EBITDA multiples work well for capital-intensive businesses where depreciation and amortization significantly impact reported earnings, while P/E multiples suit stable companies with predictable earnings and minimal differences between accounting income and economic profits.
Selecting appropriate multiples requires researching what comparable companies trade at in public markets or what prices similar businesses have commanded in recent acquisitions. If comparable manufacturing companies trade at 8 to 12 times EBITDA, you might select 10 times as a reasonable middle-ground assumption. Applied to $100 million final year EBITDA, this produces a terminal value of $1 billion. Some analysts apply ranges of multiples to understand sensitivity, calculating terminal values at both conservative and optimistic multiples to bound the likely valuation range.
Taking our manufacturing company example, assume year five projects $100 million EBITDA and comparable companies trade at an average enterprise value-to-EBITDA multiple of 10 times. The terminal value calculation becomes simply: Terminal Value = $100 million × 10 = $1 billion. Like the perpetuity growth approach, this terminal value requires discounting back to present value at your chosen discount rate. Using 10% over five years yields: Present Value of Terminal Value = $1 billion / (1.10)^5 = approximately $621 million.
The exit multiple approach implicitly incorporates growth assumptions embedded in market multiples rather than requiring explicit growth rate selection. A 10x EBITDA multiple reflects market expectations about industry growth, competitive dynamics, and profitability sustainability. This indirect approach to growth assumptions can feel more comfortable than selecting specific perpetual growth rates, though it also means less transparency about what growth is actually assumed. Analysts should consider whether current market multiples reflect appropriate long-term valuations or temporary market enthusiasm or pessimism that might not represent fair values.
Comparing and Reconciling Both Methods
Sophisticated analysts often calculate terminal value using both methods to understand whether they converge on similar values or produce significantly different results requiring investigation. When both approaches yield comparable terminal values, confidence increases that the valuation rests on consistent assumptions. Significant divergences signal potential issues with growth rate selection, multiple choice, or fundamental inconsistencies in how you’re thinking about the company’s long-term economics.
Consider a technology company where the perpetuity growth method produces a terminal value of $800 million while the exit multiple approach suggests $1.2 billion. This 50% difference demands explanation. Perhaps the selected multiple of 15x EBITDA reflects high-growth technology valuations appropriate for current market leaders but inconsistent with the 3% perpetual growth rate assumed in the Gordon Growth calculation. Reconciling these approaches might involve either using lower multiples that align with modest growth expectations or increasing the perpetual growth rate to levels consistent with valuations commanded by faster-growing businesses.
Reverse engineering the implied perpetual growth rate from an exit multiple provides useful analytical insights. If applying a 12x EBITDA multiple with a 10% discount rate, you can work backward to determine what growth rate this implies. Rearranging the perpetuity growth formula: Growth Rate = Discount Rate – (Final Year Metric / Terminal Value). This calculation reveals whether your multiple selection assumes reasonable or unrealistic long-term growth, helping ensure internal consistency across your valuation assumptions.
Similarly, you can calculate what exit multiple is implied by a perpetuity growth assumption. If using 3% perpetual growth with a 10% discount rate, the implied multiple equals 1 / (Discount Rate – Growth Rate) = 1 / 0.07 = 14.3x free cash flow. Comparing this to market multiples for comparable companies helps validate whether your growth assumptions align with market reality or reflect optimism or pessimism not supported by how similar businesses trade.
Adjusting Terminal Value for Different Business Stages
High-growth companies require special consideration when calculating terminal value, as assuming they maintain elevated growth rates indefinitely produces unrealistic valuations. These businesses typically need multi-stage models where growth rates step down gradually from high current levels to sustainable long-term rates by the terminal year. A software company growing 30% annually might project declining growth to 20%, then 15%, then 10%, before finally settling at 4% perpetual growth for terminal value calculation.
The transition to terminal value growth rates should reflect realistic competitive dynamics where high returns attract competition that eventually erodes excess profitability toward industry norms. Companies cannot maintain both high growth and high margins indefinitely, as economic theory and empirical evidence demonstrate that exceptional performance attracts competitive responses reducing returns toward cost of capital over time. Terminal value assumptions should incorporate this mean reversion rather than optimistically projecting indefinite exceptionalism.
Cyclical businesses present different terminal value challenges, as final year cash flows might reflect peak or trough positions in industry cycles rather than normalized sustainable levels. Calculating terminal value from unusually high or low final year figures produces distorted valuations that overstate or understate true worth. The solution involves normalizing final year cash flows to mid-cycle levels before applying perpetuity growth formulas or exit multiples, ensuring terminal value reflects sustainable economics rather than temporary cyclical positions.
Declining industries or businesses in terminal decline require careful treatment, potentially using negative growth rates in perpetuity formulas or applying liquidation values rather than going-concern multiples. A newspaper publisher facing structural decline might warrant terminal value calculations assuming -2% perpetual shrinkage, or even discounted liquidation values if the business model appears unsustainable long-term. Forcing positive growth assumptions onto dying businesses produces grossly inflated valuations disconnected from economic reality.
Common Terminal Value Calculation Mistakes
The single most frequent error involves using excessively optimistic perpetual growth rates that ignore economic constraints on indefinite growth. Rates of 6%, 8%, or 10% appear in amateur models, implying companies will eventually grow larger than entire economies. Beyond violating mathematical and logical constraints, these unrealistic assumptions produce wildly inflated valuations that mislead investment decisions. Disciplined analysts rarely exceed 4% perpetual growth, with most calculations using 2% to 3% to maintain conservative, defensible positions.
Inconsistency between explicit forecast period assumptions and terminal value inputs creates another common problem. Models might project declining margins, slowing growth, or deteriorating returns on capital during the forecast period, then abruptly assume perpetual growth at rates inconsistent with those trends. Terminal value assumptions should logically extend the trajectory established during explicit forecasts rather than introducing discontinuous improvements that conveniently inflate valuations without supporting rationale.
Forgetting to discount terminal value back to present value represents a mechanical error that dramatically overstates enterprise value. The terminal value figure calculated from the perpetuity growth formula or exit multiple represents value at the end of the forecast period, not present value. Multiplying by the appropriate discount factor for the number of forecast years is essential but sometimes overlooked in the mechanics of building complex models, particularly by less experienced analysts.
Using nominal growth rates with real discount rates, or vice versa, creates mismatches that distort calculations. If your discount rate reflects nominal returns including inflation expectations, your perpetual growth rate must also be nominal. Using a 10% nominal discount rate with a 2% real growth rate effectively assumes -1% to -2% growth after accounting for 3% to 4% inflation embedded in the discount rate. Maintaining consistency requires using either all-nominal or all-real figures throughout your analysis.
Practical Examples Across Different Industries
Consider a mature consumer packaged goods company projecting $200 million free cash flow in year five of your DCF model. The company operates in stable markets with modest growth aligned with population expansion and income growth. Using the perpetuity growth method with 2.5% growth and 8% discount rate produces: Terminal Value = $200 million × 1.025 / (0.08 – 0.025) = $205 million / 0.055 = $3.727 billion. Discounted back five years at 8% yields present value of approximately $2.537 billion.
For comparison, if comparable consumer staples companies trade at 12x free cash flow, the exit multiple approach suggests: Terminal Value = $200 million × 12 = $2.4 billion. Discounted to present value: $2.4 billion / (1.08)^5 = approximately $1.633 billion. The significant difference between $2.537 billion and $1.633 billion demands investigation. The perpetuity growth method’s higher value implies the 2.5% growth assumption is more optimistic than the 12x multiple suggests, or the discount rate doesn’t fully capture risk, requiring reconciliation before finalizing valuation.
A high-growth software-as-a-service company presents different dynamics. Year five projects $50 million free cash flow after several years of rapid expansion. Rather than immediately assuming mature-company growth rates, a two-stage terminal value might assume 8% growth for years 6-10, then 3% perpetually thereafter. Calculate the value at the end of year 10 using 3% perpetual growth and 12% discount rate: Terminal Value at Year 10 = Year 10 Cash Flow × 1.03 / (0.12 – 0.03). Then discount this back to present value over ten years rather than five.
A commercial real estate portfolio provides an exit multiple example. Year five projects $80 million in net operating income. Comparable properties sell at capitalization rates around 6%, implying multiples of approximately 16.7x NOI. Terminal Value = $80 million × 16.7 = $1.336 billion. This exit multiple approach proves particularly natural for real estate where property sales at observable cap rates provide clear market benchmarks. Discounting back five years using an appropriate discount rate matching real estate risk yields present value for incorporation into the complete DCF.
Sensitivity Analysis and Scenario Planning
Terminal value’s substantial contribution to total enterprise value necessitates rigorous sensitivity analysis around key assumptions. Create tables showing how terminal value changes across ranges of perpetual growth rates and discount rates, revealing which assumptions most dramatically impact valuations. If terminal value ranges from $500 million to $2 billion depending on whether you assume 2% or 4% growth, recognize the high uncertainty and required margin of safety before investing based on these calculations.
Consider a manufacturing company where terminal value sensitivity analysis reveals the following present values: at 2% growth and 10% discount rate, terminal value contributes $800 million; at 3% growth and 9% discount rate, $1.4 billion; at 4% growth and 8% discount rate, $2.3 billion. This nearly three-fold range across plausible assumption variations demonstrates why single-point valuations mislead and why understanding assumption sensitivity proves essential for making informed decisions rather than placing false confidence in precise-seeming but assumption-dependent calculations.
Scenario analysis extends beyond simple sensitivity tables by modeling distinctly different future paths with unique sets of assumptions. Bull case scenarios might assume successful product launches, market share gains, and margin expansion supporting 4% perpetual growth with lower risk justifying 8% discount rates. Bear cases model competitive pressures, market saturation, and deteriorating economics supporting only 1% growth with elevated 12% discount rates reflecting increased risk. Base cases split the difference with moderate assumptions. Calculating terminal values under each complete scenario provides more realistic pictures of valuation ranges than single baseline estimates.
Probability-weighted terminal values aggregate multiple scenarios by assigning likelihood percentages to different outcomes and calculating weighted averages. If you assess 20% probability of the bull case producing $2 billion terminal value, 50% probability of base case yielding $1.2 billion, and 30% probability of bear case generating $600 million, the probability-weighted terminal value equals: (0.20 × $2B) + (0.50 × $1.2B) + (0.30 × $600B) = $1.18 billion. This approach explicitly incorporates uncertainty rather than pretending single-point estimates represent reality.
Advanced Considerations and Refinements
Some analysts use H-model approaches that assume linearly declining growth rates during the terminal period rather than abrupt transitions to perpetual rates. This method smooths the transition from high forecast-period growth to lower sustainable rates, producing more realistic cash flow trajectories than models that assume companies suddenly and permanently shift to different growth modes at the terminal year boundary. The H-model formula: Terminal Value = [Cash Flow × (1 + Long-term Growth) + Cash Flow × H × (Short-term Growth – Long-term Growth)] / (Discount Rate – Long-term Growth), where H represents half the transition period length.
Incorporating return on invested capital dynamics into terminal value calculations ensures consistency between growth assumptions and required reinvestment. Higher perpetual growth rates require proportionally higher reinvestment rates, as companies must deploy capital to generate additional revenues and profits. The relationship follows: Growth Rate = Return on Invested Capital × Reinvestment Rate. If assuming 4% perpetual growth with 12% ROIC, implied reinvestment equals 33% of cash flows. Ensuring this reinvestment assumption aligns with business characteristics and industry norms validates growth rate reasonableness.
Tax considerations in terminal value merit attention, particularly for companies with net operating loss carryforwards, changing tax jurisdictions, or evolving regulatory environments. Terminal value calculations typically assume normalized tax rates reflecting long-term expectations rather than temporary benefits or burdens that won’t persist indefinitely. If a company currently enjoys low effective tax rates due to expiring credits or international structures facing regulatory pressure, terminal value should use higher sustainable rates even if forecast period uses current favorable rates.
Cross-checking terminal value reasonableness against total enterprise value helps identify nonsensical results. If terminal value represents 95% of total value, the implicit assumption is that five years of detailed forecasts contribute almost nothing, with essentially all value residing in the distant future. This pattern often signals overly conservative near-term projections combined with optimistic long-term assumptions, or insufficient forecast period length. Conversely, if terminal value contributes only 30% of total value, you may be using overly pessimistic perpetual growth assumptions or need to extend the explicit forecast period.
Integration into Complete DCF Models
Terminal value represents one component of complete enterprise value calculations that require careful assembly of all parts. Begin by calculating the present value of explicit forecast period cash flows, discounting each year individually. Add the discounted terminal value to this sum, producing total enterprise value. Subtract net debt and add excess cash to convert from enterprise value to equity value, then divide by shares outstanding to determine intrinsic value per share for comparison to market prices.
Consider a complete example: five years of forecast cash flows with present values summing to $500 million, plus terminal value present value of $1.2 billion, equals $1.7 billion enterprise value. After subtracting $300 million net debt and adding $100 million excess cash, equity value equals $1.5 billion. Dividing by 50 million shares outstanding produces intrinsic value of $30 per share. If the stock trades at $22, the analysis suggests approximately 36% upside to fair value, though you must assess whether your terminal value assumptions justify this conclusion.
Sanity checks comparing your DCF results to other valuation methods help validate terminal value reasonableness. Calculate implied multiples by dividing your enterprise value by final year EBITDA, comparing to market multiples for similar companies. If your DCF implies 18x EBITDA when comparables trade at 10x to 12x, either your terminal value assumptions are overly optimistic, or you’ve identified genuinely undervalued comparable companies, or your discount rate is too low. Investigating these discrepancies improves analysis quality beyond mechanical formula application.
Documenting terminal value assumptions and rationale enables future review and learning from experience. Record why you selected specific growth rates, multiples, or discount rates based on information available at analysis time. Subsequent business performance and stock price movements reveal whether assumptions proved accurate or require calibration. This disciplined documentation and review process gradually improves analytical accuracy through systematic learning rather than repeating the same mistakes indefinitely.
FAQs
What is terminal value and why is it important in DCF analysis?
Terminal value represents the present value of all cash flows beyond the explicit forecast period in discounted cash flow models, capturing the reality that businesses continue operating indefinitely rather than ceasing after five or ten years of detailed projections. This component typically accounts for 60% to 80% of total enterprise value in DCF analyses, making it the single most influential factor in many valuations. Understanding proper terminal value calculation separates rigorous valuation from amateur analysis that produces misleading results. The two primary calculation methods are the perpetuity growth approach assuming constant growth forever and the exit multiple method applying market multiples to final year financial metrics.
What perpetual growth rate should I use for terminal value?
Perpetual growth rates should reflect long-term economic expansion rather than company-specific near-term opportunities, typically ranging from 2% to 4% for businesses in developed economies. Rates exceeding long-term GDP growth of 2% to 3% require strong justification based on sustainable competitive advantages and expanding addressable markets. Conservative analysts often use growth rates at or below GDP growth to maintain defensible positions and avoid mathematical impossibilities where companies eventually exceed total economic size. Industry-specific factors matter, with declining industries potentially warranting negative growth rates while exceptional businesses in expanding markets might justify rates toward 4%, though exceeding this threshold demands extraordinary evidence and careful documentation of supporting rationale.
How do I choose between perpetuity growth and exit multiple methods?
Both methods offer valid approaches with different strengths making them more or less suitable depending on circumstances and preferences. The perpetuity growth method provides theoretically purer valuations based on explicit cash flow and growth assumptions without relying on potentially sentiment-driven market multiples. However, it proves highly sensitive to growth rate selection where small changes dramatically impact results. Exit multiples offer market-grounded valuations less dependent on distant-future assumptions, though require judgment about appropriate multiples and implicitly incorporate market sentiment. Most sophisticated analyses calculate terminal value using both approaches, investigating when results diverge significantly and using reconciliation to ensure internal consistency across assumptions.
Can terminal value exceed the total enterprise value?
Yes, terminal value often exceeds total enterprise value in the sense that the undiscounted terminal value calculated at the end of the forecast period is larger than the present value of all forecast period cash flows combined. However, after discounting terminal value back to present value, it should represent a reasonable proportion of total enterprise value, typically 60% to 80%. If terminal value contributes more than 90% of total value, your assumptions likely involve overly conservative near-term projections combined with optimistic long-term expectations, or insufficient forecast period length. Conversely, terminal value contributing less than 40% might signal overly pessimistic perpetual growth assumptions or unrealistically optimistic forecast period projections.
How do I calculate terminal value for high-growth companies?
High-growth companies require multi-stage approaches where growth rates decline gradually from elevated current levels to sustainable long-term rates by the terminal period. Rather than assuming 30% growth drops immediately to 3%, model stepdowns through 20%, 15%, 10%, then finally 3% to 4% perpetual growth. The terminal value calculation applies to the final sustainable growth rate, but getting to that point requires extended forecast periods or additional transition stages. Alternatively, calculate terminal value at a more distant point after growth has normalized, then discount back over the longer period. These businesses cannot maintain exceptional growth indefinitely as competition, market saturation, and economic constraints eventually force convergence toward normal growth rates.
What’s the relationship between discount rate and terminal growth rate?
The discount rate must exceed the perpetual growth rate for the formula to work mathematically and make economic sense. The difference between these rates (discount rate minus growth rate) represents the effective capitalization rate converting final year cash flow into terminal value. Smaller spreads between discount and growth rates produce larger terminal values, as the denominator in the formula shrinks. If growth approaches or exceeds the discount rate, terminal value explodes toward infinity, signaling unrealistic assumptions. Economic logic supports this mathematical constraint: companies cannot sustainably grow faster than overall economic returns indefinitely without eventually becoming larger than the entire economic system.
How do I adjust terminal value for companies with declining prospects?
Declining businesses may warrant negative perpetual growth rates in terminal value calculations, reflecting structural headwinds that will shrink operations over time. A newspaper publisher facing -3% annual decline might use that negative rate in the perpetuity growth formula, producing lower terminal values than stable businesses. Alternatively, consider whether going-concern assumptions remain appropriate or if liquidation value better represents long-term worth. Some analysts prefer extending explicit forecast periods until businesses reach steady states or calculating terminal values based on orderly liquidation proceeds rather than perpetual operations. The key involves honestly assessing whether indefinite continuation at any growth rate makes sense or whether terminal value should reflect eventual wind-down scenarios.
Should I use nominal or real growth rates in terminal value calculations?
Consistency between discount rates and growth rates is essential, requiring both to be either nominal (including inflation) or real (excluding inflation). If using nominal discount rates reflecting market returns that incorporate inflation expectations, use nominal growth rates that similarly include inflation. A nominal growth rate of 3% might reflect 1% real growth plus 2% inflation, aligning with a 10% nominal discount rate comprising perhaps 7% real return plus 3% inflation. Mixing nominal discount rates with real growth rates effectively assumes negative real growth, while combining real discount rates with nominal growth overstates terminal value. Most practitioners use all-nominal figures throughout their analyses as this matches how financial markets actually operate and how comparable data typically presents.