As Apple unveils its latest marvel, the iPhone 17, investors and tech enthusiasts alike are keenly observing its impact on Apple’s stock valuation. The release of a new iPhone has always been a pivotal moment for Apple, symbolizing innovation while simultaneously serving as a barometer for the company’s financial health. However, with the Apple iPhone 17, questions loom, will it truly enhance Apple’s stock value or simply maintain the status quo? Delving into this question requires more than just surface-level excitement; it demands a deep dive into Apple’s financial strategies and market positioning.
In recent years, the tech giant has been navigating a complex landscape of innovation, competition, and market expectations. Historical trends suggest that each iPhone launch can shift investor sentiment drastically, sometimes resulting in significant stock fluctuations. For instance, Apple’s valuation after an iPhone launch often reflects the collective anticipation, satisfaction, or disappointment of the market. In this blog post, we will dissect whether the Apple iPhone 17 stands as a testament to Apple’s enduring worth. We’ll explore the key metrics and valuation insights that could shed light on whether today’s stock price reflects an opportunity or a risk, providing you with factual and confident analysis without the fluff. Stay with us as we unravel the intricate dance between cutting-edge technology and its financial ramifications.
Historical Impact of iPhone Launches on Apple Stock
Since the original iPhone release in 2007, Apple’s stock performance has mirrored the excitement and skepticism that each subsequent model generated. Early launches saw meteoric rises as investors bet on Apple’s ability to redefine the smartphone market. For example, following the iPhone 4 announcement in 2010, Apple shares jumped more than 5% within days, reflecting strong consumer anticipation for its design overhaul and Retina display. Similarly, the iPhone 6 launch in 2014 drove Apple’s market cap past the $700 billion mark, as the larger screen sizes appealed to a broader audience and bolstered revenue forecasts.
However, not all launches delivered the same uplift. The iPhone X introduction in late 2017 was met with supply concerns and high price tags that tempered investor enthusiasm, resulting in a relatively muted stock reaction compared to prior flagship releases. This historical pattern underscores that while innovation can ignite significant gains, market expectations and perceived value play an equally critical role. As we examine the debut of the Apple iPhone 17, understanding this backdrop is essential: past performance shows that a launch’s true effect on Apple stock depends as much on managing expectations as on the devices themselves.
Apple’s Financial Performance Pre-iPhone
Prior to the unveiling of each new iPhone, Apple’s financial standing sets the stage for investor sentiment. In the quarter leading up to the Apple iPhone 17 launch, Apple reported revenue growth of 8% year-over-year, driven by robust services sales and stable iPhone replacements despite supply-chain constraints. Gross margins held steady around 43%, reflecting cost management efforts amid component shortages. Meanwhile, Apple carried a substantial cash position—over $200 billion in cash and marketable securities, reinforcing its capacity for R&D, shareholder returns, and strategic acquisitions.
On the earnings call before the September release, Apple’s CFO highlighted strong install base growth in emerging markets and record services subscriptions, two pillars that cushion the cyclical iPhone refresh. Yet, questions lingered about smartphone saturation in mature markets and potential margin pressure from escalating component and logistics costs. Thus, investors entering the iPhone 17 event were weighing healthy fundamentals against the challenge of sustaining premium pricing. This pre-launch snapshot provides the baseline against which any market reaction—positive or negative—must be compared.
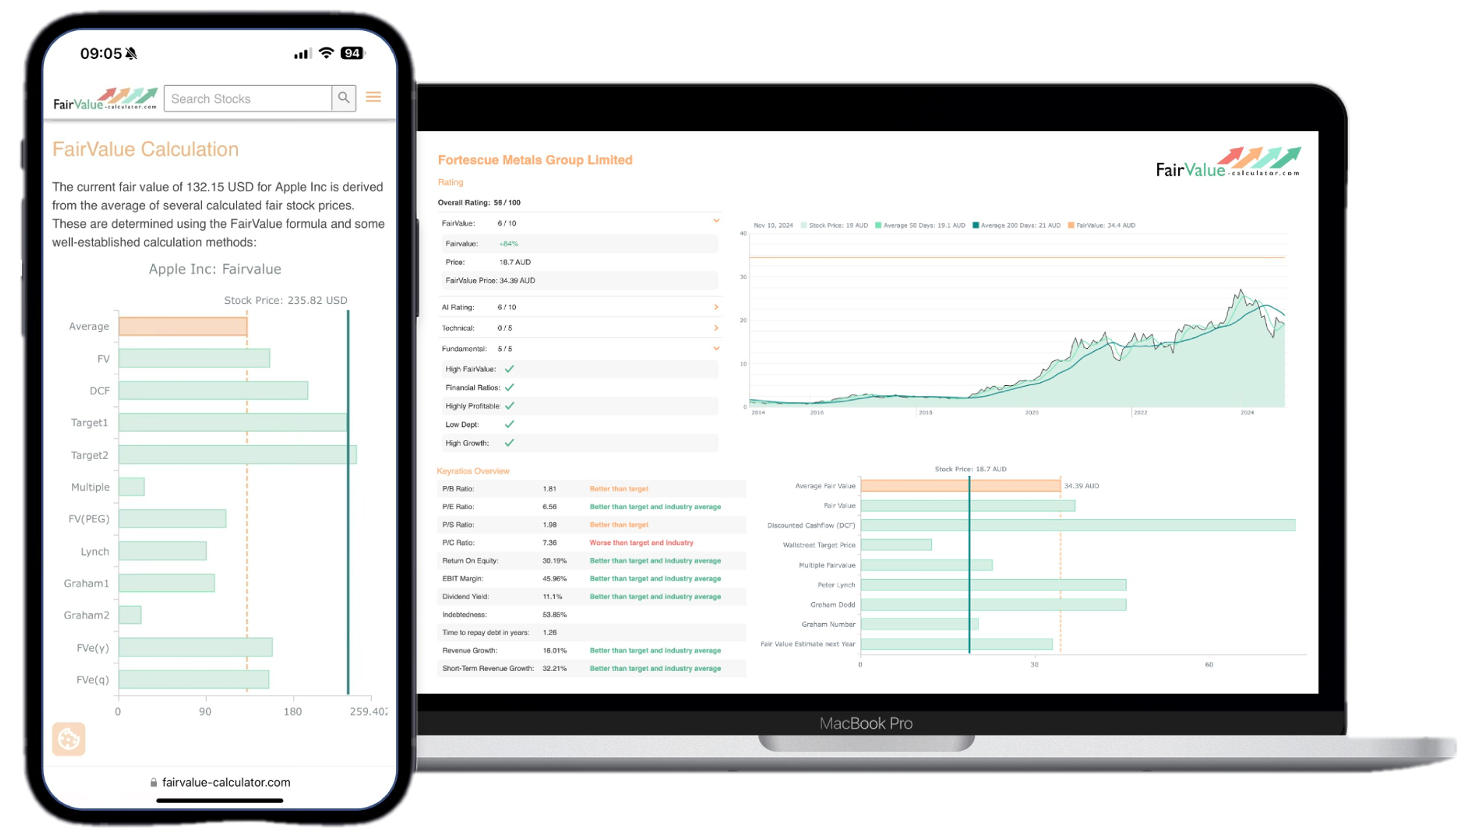
Explore our most popular stock fair value calculators to find opportunities where the market price is lower than the true value.
- Peter Lynch Fair Value – Combines growth with valuation using the PEG ratio. A favorite among growth investors.
- Buffett Intrinsic Value Calculator – Based on Warren Buffett’s long-term DCF approach to determine business value.
- Buffett Fair Value Model – Simplified version of his logic with margin of safety baked in.
- Graham & Dodd Fair Value – Uses conservative earnings-based valuation from classic value investing theory.
- Intrinsic vs. Extrinsic Value – Learn the core difference between what a company’s really worth and what others pay.
- Intrinsic Value Calculator – A general tool to estimate the true value of a stock, based on earnings potential.
- Fama-French Model – For advanced users: Quantifies expected return using size, value and market risk.
- Discount Rate Calculator – Helps estimate the proper rate to use in any DCF-based valuation model.
Analysis of Market Expectations for iPhone
Leading up to the Apple iPhone 17 launch, analysts broadly forecasted modest YoY unit growth but meaningful improvements in features like AI-driven photography and battery life. Early rumors suggested an ultrathin “iPhone Air” model with a chassis under 6 mm, fueling speculation about a design breakthrough that could reignite consumer upgrade demand. Industry surveys showed around 60% of potential upgraders expected incremental camera improvements over radical redesign, signaling tempered expectations.
On the flip side, some market watchers cautioned that Apple’s high base in installed users would make significant growth challenging. With smartphone penetration exceeding 70% in key regions, the bar for a genuinely transformative upgrade was high. Thus, investors were looking for clear differentiators—whether in materials, AI capabilities, or pricing tiers—to justify renewed enthusiasm in the Apple stock after iPhone 17. It was this blend of optimism for innovation and skepticism about market saturation that set the stage for post-launch volatility.
Comparing iPhone Features to Competitors
Apple continues to benchmark its iPhones against rivals from Samsung, Google, and emerging Chinese brands. In the case of the Apple iPhone 17, the spotlight shone on the ultrathin iPhone Air and its purported 5.6 mm body, compared to Samsung’s flagship stacked around 7.6 mm and Google’s Pixel at approximately 8 mm. Such sleekness promised a distinct aesthetic advantage and underscored Apple’s design prowess.
However, competitors emphasize complementary strengths. Samsung’s Galaxy series boasts 120 Hz displays and advanced stylus integration, while Google leverages AI-driven call screening and real-time translation. Meanwhile, Chinese OEMs like OnePlus push aggressively on price-to-performance. Investors assessing Apple’s competitive positioning weighed these trade-offs: does the premium industrial design of the iPhone Air justify a price premium, or will rivals’ feature-rich alternatives erode Apple’s market share? The answer will impact Apple’s long-term growth and thus its stock valuation.
💡 Discover Powerful Investing Tools
Stop guessing – start investing with confidence. Our Fair Value Stock Calculators help you uncover hidden value in stocks using time-tested methods like Discounted Cash Flow (DCF), Benjamin Graham’s valuation principles, Peter Lynch’s PEG ratio, and our own AI-powered Super Fair Value formula. Designed for clarity, speed, and precision, these tools turn complex valuation models into simple, actionable insights – even for beginners.
Learn More About the Tools →Potential Long-Term Effects on Apple Stock
In the long run, a successful launch that drives replacement cycles and expands services revenue could support higher multiples for Apple stock. The Apple iPhone 17’s innovations—especially the slender iPhone Air, may enhance brand halo, encouraging accessory and service ecosystem growth. If adoption rates exceed 20% among existing users in the first year, analysts could revise EPS forecasts upward, boosting fair-value estimates.
Conversely, if the market views the launch as incremental, with price points deterring upgrades in key regions, revenue growth may slow. Given the iPhone’s contribution of over 50% of Apple revenue, any stagnation here can weigh heavily on overall results. In such a scenario, investors might apply a lower P/E multiple to reflect slower growth, pressuring the stock. Thus, the long-term trajectory of Apple stock hinges not just on initial sales figures but on sustained improvements in average selling price, service attach rates, and global smartphone penetration.
Investor Sentiment Surrounding iPhone
Investor sentiment around Apple tends to ebb and flow with product news and broader market trends. After the September keynote unveiling the Apple iPhone 17, social media sentiment briefly spiked, lauding the ultrathin form factor and rumored AI camera enhancements. Yet surveys of institutional investors showed only a modest net buy signal, indicating caution ahead of detailed hands-on reviews and carrier partnerships.
High-profile research notes painted a mixed picture: some bullish calls highlighted the potential for stronger service revenue attachment, while bearish views pointed to possible ASP headwinds if Apple discounts older models to clear inventory. This divergence underscores the critical role of narrative in driving short-term stock moves. For disciplined investors, monitoring shifts in sentiment alongside hard sales data will be key to identifying entry points once hype subsides and fundamentals reassert themselves.

Forecasting Apple Stock Performance Post iPhone
Modeling Apple stock in the weeks following the iPhone 17 launch requires balancing near-term volatility with medium-term growth drivers. Revenue upgrades in services and wearables could serve as near-term catalysts, while supply improvements boded well for meeting holiday season demand. If Apple beats consensus quarterly iPhone unit forecasts by even 2%, shares could gain 3–5% in the immediate aftermath.
Over the next 12 months, the stock’s path will depend on factors such as macroeconomic conditions, consumer spending, and global smartphone competition. A sustained rebound in emerging-market sales—particularly India and Southeast Asia—could propel earnings momentum. Conversely, any escalation in trade tensions or regulatory pressures may undercut investor confidence. In forecasting Apple stock after iPhone 17, scenario analysis becomes essential: mapping out bull, base, and bear cases around unit volumes, ASP trends, and margin shifts.
Evaluating Innovation vs. Market Response
Innovation alone does not guarantee market success. Apple’s track record shows that truly disruptive features, like Touch ID, Face ID, and wireless charging, drove tangible user benefits that fueled upgrades. By contrast, cosmetic changes with minimal functional gain sometimes failed to elicit strong buying decisions. The Apple iPhone 17’s ultrathin iPhone Air design is visually striking, but its influence on battery life and durability will shape user perception.
Early hands-on feedback will be crucial. If reviewers find that the slim chassis compromises battery longevity or thermal performance, the initial wow factor could quickly fade. Conversely, if Apple manages to integrate the slim design without sacrificing core capabilities, it could reinforce its premium positioning. This balance between innovation and practical utility will determine market response, guiding analysts’ forecasts and ultimately influencing Apple’s stock multiple.
The Role of Brand Loyalty in Stock Valuation
Apple’s most enduring asset is its ecosystem-driven brand loyalty. With over 1.8 billion active devices, Apple benefits from recurring revenue streams in services and high switching costs for consumers deeply integrated into its platform. This loyalty underpins a premium valuation, with the stock trading at a higher P/E multiple than most peers despite a mature market position.
The launch of the Apple iPhone 17 tests this loyalty: will long-time users upgrade to maintain ecosystem parity, or will some pause pending more compelling features? A high attach rate would reinforce a narrative of resilient demand, supporting sustained multiples. Alternatively, a slowdown in upgrade cycles—even if temporary—could prompt multiple contraction as investors reassess growth prospects. Thus, brand loyalty remains a critical variable in any valuation analysis of Apple stock.
Conclusion: Apple iPhone ‘s Influence on Apple Stock
The Apple iPhone 17 launch highlights the ongoing tension between innovation expectations and market realities. While the ultrathin iPhone Air showcases Apple’s design leadership, its ultimate impact on upgrade cycles and revenue growth will determine whether the stock’s valuation expands or contracts.
Investors should watch early sales data, service-attach metrics, and competitive reactions to gauge long-term implications. In doing so, they can discern if Apple iPhone 17 truly pushes Apple stock’s intrinsic worth or simply maintains the status quo in a crowded smartphone landscape.