In the intricate world of finance, understanding the true worth of an asset is akin to unlocking a secret code. “What methods are used to calculate fair value?” you may wonder. At the heart of this quest lies a blend of art and science, where precision meets perception. Fair value calculation is not merely a mathematical exercise; it is a critical process that drives investment decisions, influences market perceptions, and ultimately shapes the financial landscape. From the bustling trading floors of Wall Street to quiet analyst desks worldwide, determining fair value remains a cornerstone of informed decision-making.
The importance of accurate fair value assessment cannot be understated. For investors, it is the key to identifying opportunities and avoiding pitfalls. For companies, it sets the stage for transparency and trustworthiness. This blog post unravels the layers of methodologies and approaches, from market comparisons to cash flow analysis, that professionals employ to ascertain fair value. Whether you are an aspiring investor, a seasoned analyst, or simply curious about the financial mechanics behind valuations, delving into these methods offers a glimpse into the sophisticated strategies that help define financial success.

Market Comparisons: Analyzing Comparable Assets
Market comparison, often called relative valuation, revolves around assessing an asset by looking at the pricing multiples of similar publicly traded entities. Analysts begin by identifying a peer group that closely mirrors the target asset in terms of industry, size, growth prospects, and geographic footprint. Key multiples such as price-to-earnings (P/E), price-to-book (P/B), and EV/EBITDA serve as benchmarks. These ratios distill complex financial statements into digestible figures, allowing for a quick gauge of whether an asset is undervalued or overvalued relative to its peers.
Once comparable assets are selected, adjustments for scale, growth differentials, capital structure, and one-time items refine the comparison. For instance, a rapidly growing tech firm may command higher multiples than a mature industrial company. By normalizing earnings for non-recurring events, such as litigation expenses or asset sales, analysts ensure apples-to-apples comparisons. Market comparables are favored for their simplicity and market-driven nature, but they can be swayed by sector-wide shocks or bubbles. Thus, while relative valuation offers a valuable snapshot, it works best when complemented by other methods to triangulate true fair value.
Income Approach: Evaluating Future Cash Flows
The income approach centers on the present value of expected economic benefits from an asset, typically in the form of cash flows. This method asks: what is the asset worth today, given the income it will generate in the future? By forecasting revenues, operating expenses, and working capital needs, analysts arrive at a projection of free cash flows for a defined time horizon. These projections require rigorous understanding of market trends, competitive dynamics, and company strategy to ensure they reflect realistic growth and margin assumptions.
After building a detailed cash flow forecast, each period’s cash flow is discounted back to present value using an appropriate discount rate—often derived from the asset’s required rate of return or cost of capital. Terminal value, representing cash flows beyond the explicit forecast, is also included. The sum of discounted cash flows and terminal value yields the asset’s intrinsic value under the income approach. This technique is prized for its focus on fundamentals, but it is sensitive to forecasting errors and discount rate choices. Hence, sensitivity analysis is often overlaid to understand how changes in key variables can sway the valuation outcome.
Cost Method: Calculating Replacement or Reproduction Costs
The cost method, sometimes termed the asset-cost approach, estimates fair value by determining what it would cost to replace or reproduce an asset with an equivalent one. Replacement cost refers to the expense of constructing a similar asset with the same utility, using current prices for labor, materials, and overhead. Reproduction cost, on the other hand, represents the outlay needed to create an exact duplicate, including any design or obsolete features. Both approaches start with gross construction or purchase costs.
After establishing the gross cost base, deductions are made for physical depreciation, functional obsolescence, and economic obsolescence. Physical depreciation accounts for wear and tear, while functional obsolescence captures inefficiencies or outdated features. Economic obsolescence reflects external factors, such as zoning changes or market shifts, that impair value. The net result approximates what a buyer would pay today for the existing asset. While the cost method provides a tangible, straightforward framework, it may undervalue assets with strong income-generating potential or intangible benefits, making it most appropriate for specialized assets or when market and income data are scarce.
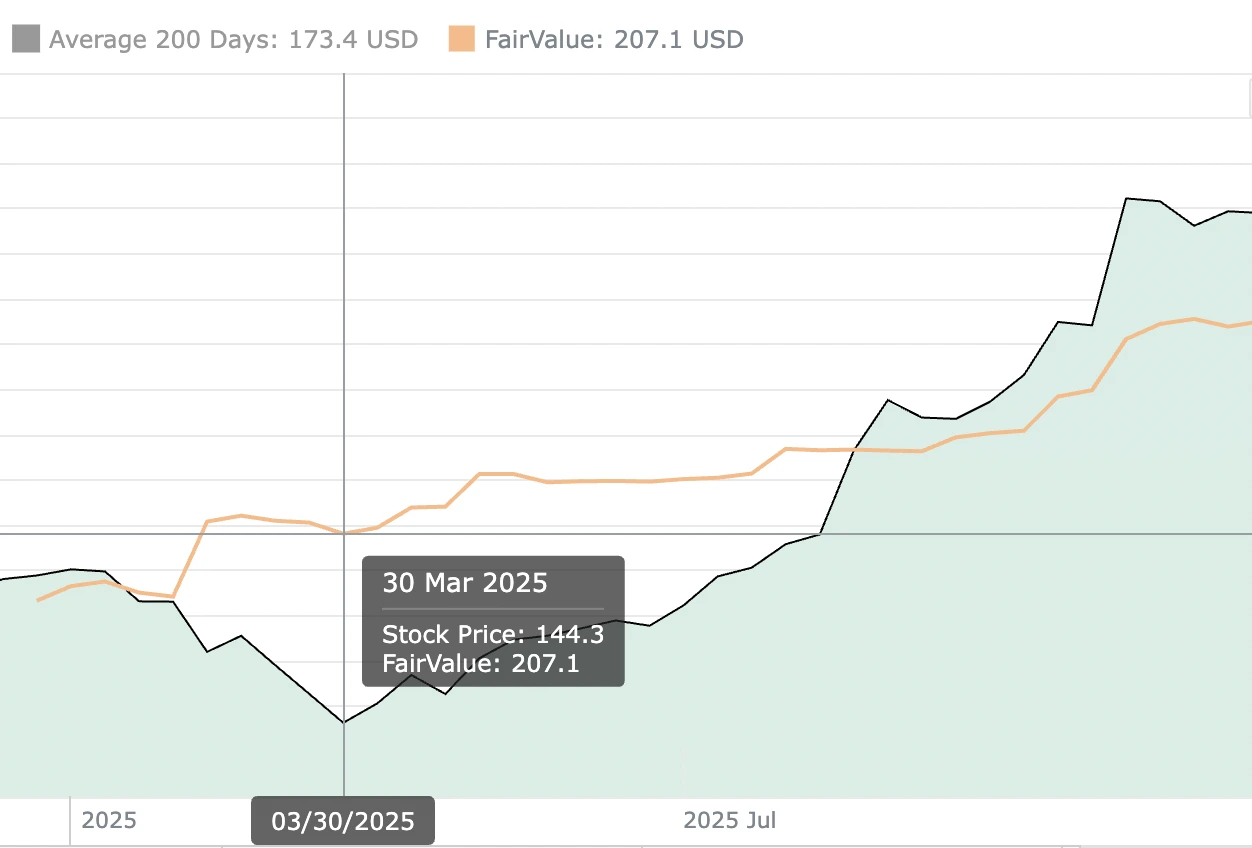
Explore our most popular stock fair value calculators to find opportunities where the market price is lower than the true value.
- Peter Lynch Fair Value – Combines growth with valuation using the PEG ratio. A favorite among growth investors.
- Buffett Intrinsic Value Calculator – Based on Warren Buffett’s long-term DCF approach to determine business value.
- Buffett Fair Value Model – Simplified version of his logic with margin of safety baked in.
- Graham & Dodd Fair Value – Uses conservative earnings-based valuation from classic value investing theory.
- Intrinsic vs. Extrinsic Value – Learn the core difference between what a company’s really worth and what others pay.
- Intrinsic Value Calculator – A general tool to estimate the true value of a stock, based on earnings potential.
- Fama-French Model – For advanced users: Quantifies expected return using size, value and market risk.
- Discount Rate Calculator – Helps estimate the proper rate to use in any DCF-based valuation model.
Asset-Based Valuation: Assessing Tangible and Intangible Assets
Asset-based valuation takes a balance-sheet perspective, summing the fair values of all assets and subtracting liabilities to arrive at equity value. Tangible assets—such as real estate, machinery, inventory, and receivables—are often adjusted to reflect current market prices. Meanwhile, intangible assets like patents, trademarks, customer relationships, and goodwill may be valued through licensing income, relief-from-royalty, or multi-period excess earnings methods.
This approach shines when businesses hold significant assets but generate modest earnings, such as holding companies, real estate investment trusts, or early-stage firms with proprietary technology. By capturing both tangible and intangible components, asset-based valuation offers a comprehensive snapshot of net asset value. However, it can overlook future growth prospects or synergies that are not yet reflected on the balance sheet. Therefore, combining asset-based valuation with income or market-based methods often yields a more robust fair value estimate.
Discounted Cash Flow (DCF): Determining Present Value
The DCF method refines the income approach by meticulously projecting free cash flows and discounting them back to present value using a risk-adjusted rate. Analysts typically forecast cash flows for five to ten years, breaking down revenue growth drivers, cost structures, working capital needs, and capital expenditures. Detailed line-item forecasts help identify key value drivers and ensure assumptions align with corporate strategy and macroeconomic conditions.
A critical step in DCF is selecting the discount rate, which often equates to the weighted average cost of capital (WACC) for the firm or an asset-specific rate for project-level valuations. Terminal value, calculated through perpetuity growth or exit multiples, captures cash flows beyond the explicit forecast period. By summing discounted cash flows and terminal value, DCF yields an intrinsic value estimate. Although DCF is highly regarded for its depth and focus on fundamentals, its sensitivity to growth rates and discount rate assumptions underscores the need for thorough sensitivity and scenario analyses.
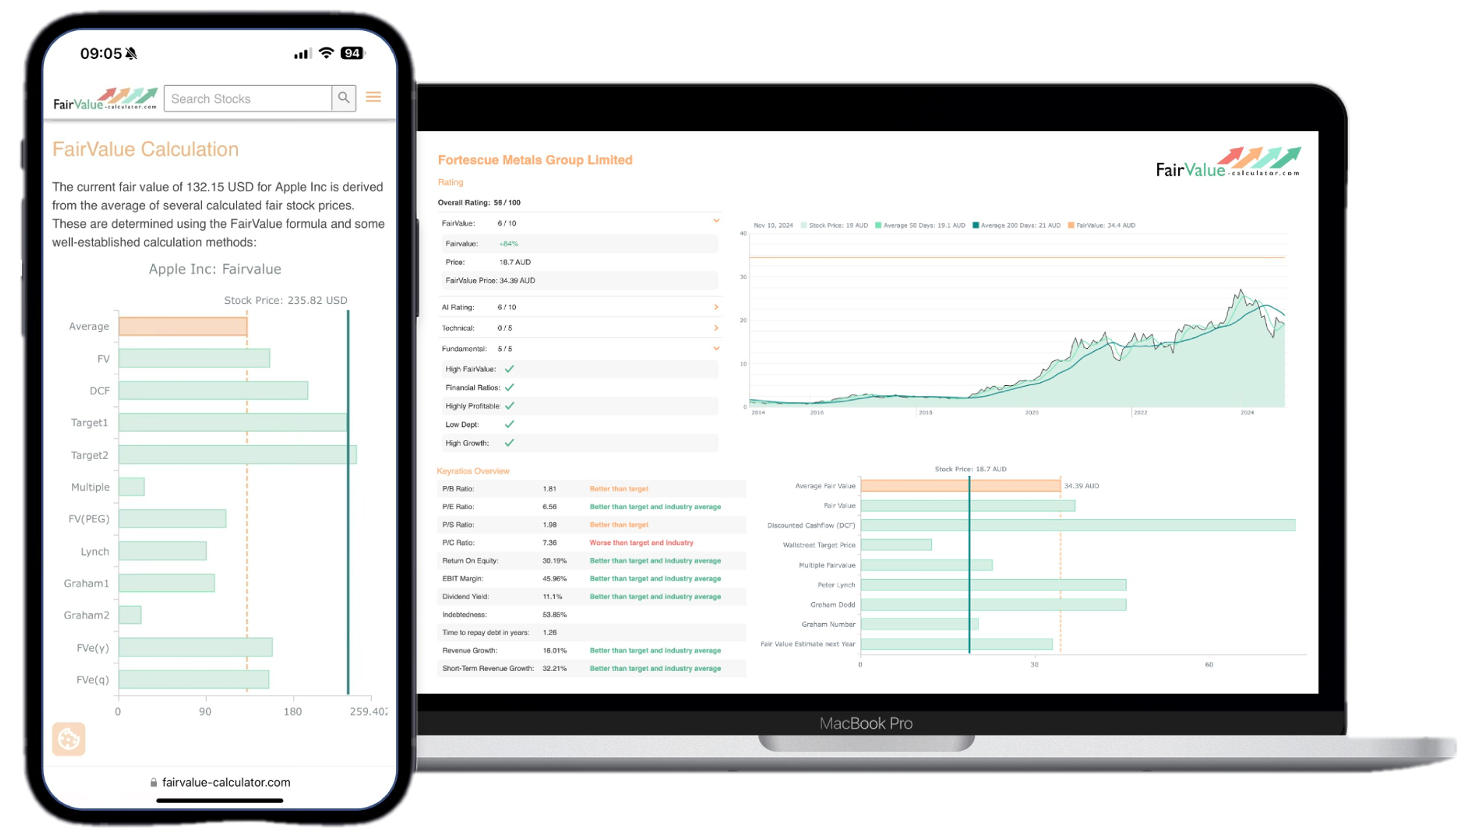
💡 Discover Powerful Investing Tools
Stop guessing – start investing with confidence. Our Fair Value Stock Calculators help you uncover hidden value in stocks using time-tested methods like Discounted Cash Flow (DCF), Benjamin Graham’s valuation principles, Peter Lynch’s PEG ratio, and our own AI-powered Super Fair Value formula. Designed for clarity, speed, and precision, these tools turn complex valuation models into simple, actionable insights – even for beginners.
Learn More About the Tools →Earnings Multiplier Technique: Assessing Profitability Ratios
The earnings multiplier technique, also known as the price-earnings (P/E) or earnings multiple method, assesses fair value by applying a multiple to a company’s earnings metric, often net income or EBITDA. The multiplier is typically derived from comparable companies, sector averages, or historical norms. For example, if peer firms trade at an average P/E of 15x and the target company has earnings of $10 million, its implied value would be $150 million.
Beyond simple P/E, analysts may employ EBITDA or EBIT multiples, adjusting for differences in capital intensity, tax rates, and depreciation policies. Multiples can also be forward-looking, based on projected earnings. While earnings multiples offer a quick, market-aware snapshot, they rely heavily on the quality of comparables and may be distorted by cyclical earnings or one-time items. To mitigate distortions, normalized or adjusted earnings—removing extraordinary items and smoothing seasonal fluctuations—form the basis for a more reliable multiplier-based valuation.
Weighted Average Cost of Capital (WACC): Factoring in Risk and Return
WACC represents the blended cost of debt and equity financing, weighted by their proportions in a company’s capital structure. It serves as the discount rate for DCF and other income-based valuations, reflecting the minimum return required by investors to compensate for risk. The cost of equity component is often estimated using the Capital Asset Pricing Model (CAPM), which factors in the risk-free rate, equity beta, and equity risk premium. The cost of debt considers current borrowing rates adjusted for the tax benefit of interest deductibility.
By combining these components, Cost of Equity × Equity/(Equity + Debt) + Cost of Debt × Debt/(Equity + Debt) × (1 – Tax Rate)—analysts derive WACC. A higher WACC implies greater risk and thus a lower present value for future cash flows. Conversely, a lower WACC indicates cheaper capital and boosts valuation. Accurate WACC calculation hinges on reliable market data and realistic assumptions about future capital structure and risk premiums. Regular updates ensure the discount rate remains aligned with evolving market conditions and company risk profiles.

Sensitivity Analysis: Understanding Impact of Assumptions
Sensitivity analysis examines how changes in key valuation inputs, such as discount rates, growth rates, profit margins, and capital expenditures—affect estimated fair value. By adjusting one variable at a time, analysts can pinpoint which assumptions drive the most value volatility. For instance, altering the terminal growth rate by one percentage point may shift a DCF valuation significantly, revealing its critical influence on overall value.
Scenario analysis extends this concept by combining multiple input changes to simulate optimistic, base, and pessimistic outcomes. Tornado charts and spider plots visually highlight the most sensitive variables, guiding analysts on where to focus due diligence. Sensitivity and scenario analyses enhance transparency and robustness, enabling stakeholders to grasp the range of potential fair values under differing economic conditions. Ultimately, these techniques help answer: “What methods are used to calculate fair value?” with clarity around their inherent uncertainties.
Conclusion: The Art and Science of Fair Value Calculation
Calculating fair value is a multifaceted endeavor that blends quantitative rigor with qualitative judgment. From relative multiples and cost approaches to detailed DCF models and asset-based frameworks, each method offers unique insights while carrying its own set of assumptions and sensitivities.
No single technique reigns supreme. Savvy analysts triangulate across methods, apply sensitivity analyses, and align valuations with market realities and strategic objectives. In doing so, they transform the question, What methods are used to calculate fair value?, into a comprehensive toolkit for unlocking precision and driving confident financial decisions.