A Professional Guide
Determining the fair value of stocks is a fundamental aspect of investment analysis that separates successful investors from speculators. While sophisticated financial software exists, Excel remains one of the most accessible and customizable tools for creating robust stock valuation models. This article provides a comprehensive guide to building a professional-grade stock fair value calculator in Excel, incorporating multiple valuation methodologies and essential financial formulas.
Understanding Fair Value Concepts
Fair value represents the theoretical price at which a stock should trade based on its intrinsic characteristics, financial performance, and market conditions. Unlike market price, which reflects current investor sentiment and trading dynamics, fair value attempts to capture the underlying economic worth of a company’s shares.
Professional analysts typically employ multiple valuation approaches to triangulate fair value estimates, as each method has inherent strengths and limitations. The most commonly used methodologies include the Dividend Discount Model (DDM), Discounted Cash Flow (DCF) analysis, Price-to-Earnings (P/E) ratio analysis, and Price-to-Book (P/B) ratio comparisons.
Excel Model Architecture
A professional stock fair value calculator should be structured with clear data input sections, calculation modules, and output summaries. The recommended architecture includes separate worksheets for data inputs, calculations, sensitivity analysis, and executive summary. This modular approach enhances maintainability and reduces errors.
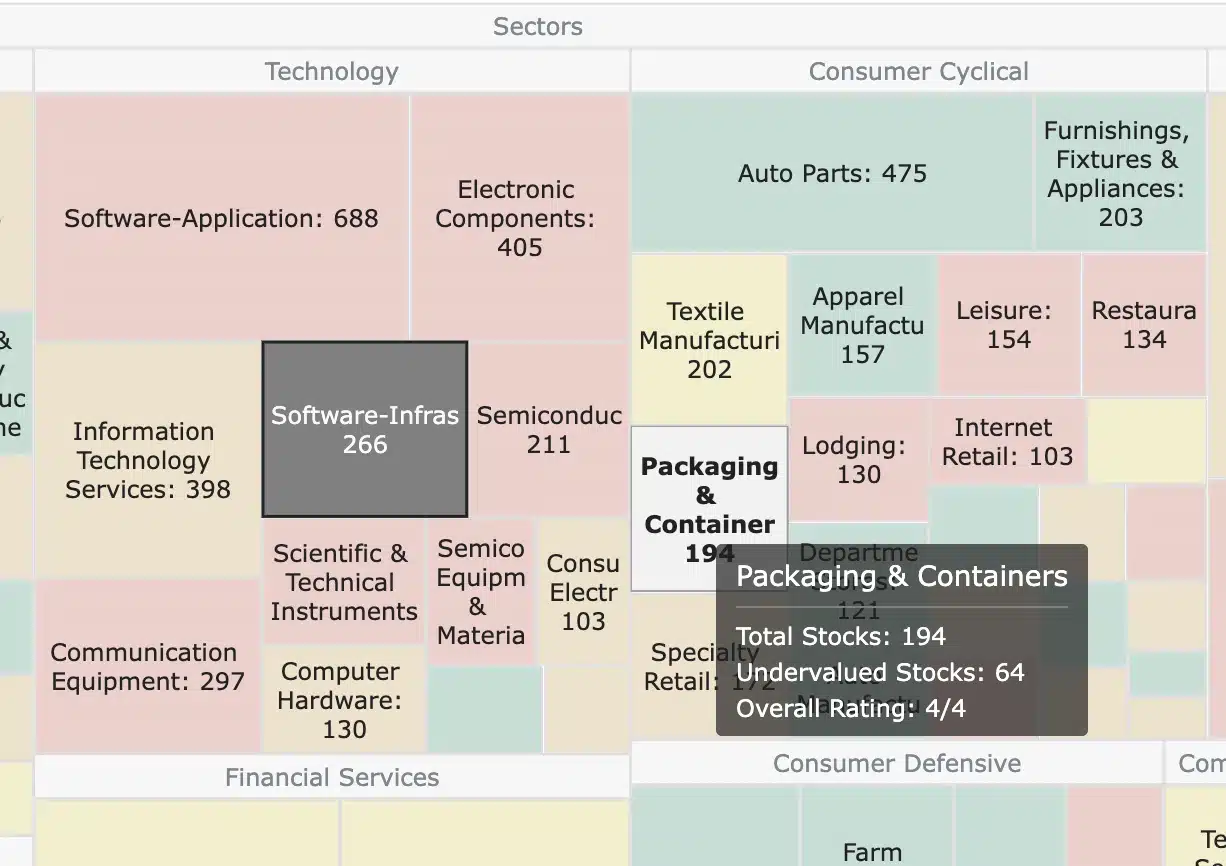
Explore our most popular stock fair value calculators to find opportunities where the market price is lower than the true value.
- Peter Lynch Fair Value – Combines growth with valuation using the PEG ratio. A favorite among growth investors.
- Buffett Intrinsic Value Calculator – Based on Warren Buffett’s long-term DCF approach to determine business value.
- Buffett Fair Value Model – Simplified version of his logic with margin of safety baked in.
- Graham & Dodd Fair Value – Uses conservative earnings-based valuation from classic value investing theory.
- Intrinsic vs. Extrinsic Value – Learn the core difference between what a company’s really worth and what others pay.
- Intrinsic Value Calculator – A general tool to estimate the true value of a stock, based on earnings potential.
- Fama-French Model – For advanced users: Quantifies expected return using size, value and market risk.
- Discount Rate Calculator – Helps estimate the proper rate to use in any DCF-based valuation model.
The input worksheet should contain company financial data, market assumptions, and analyst projections. Key inputs include current stock price, earnings per share, dividend per share, book value per share, revenue growth rates, profit margins, and discount rates. Additionally, benchmark data for industry comparisons should be incorporated.
Dividend Discount Model Implementation
The Dividend Discount Model values stocks based on the present value of expected future dividends. For companies with consistent dividend policies, this model provides reliable fair value estimates.
💡 Discover Powerful Investing Tools
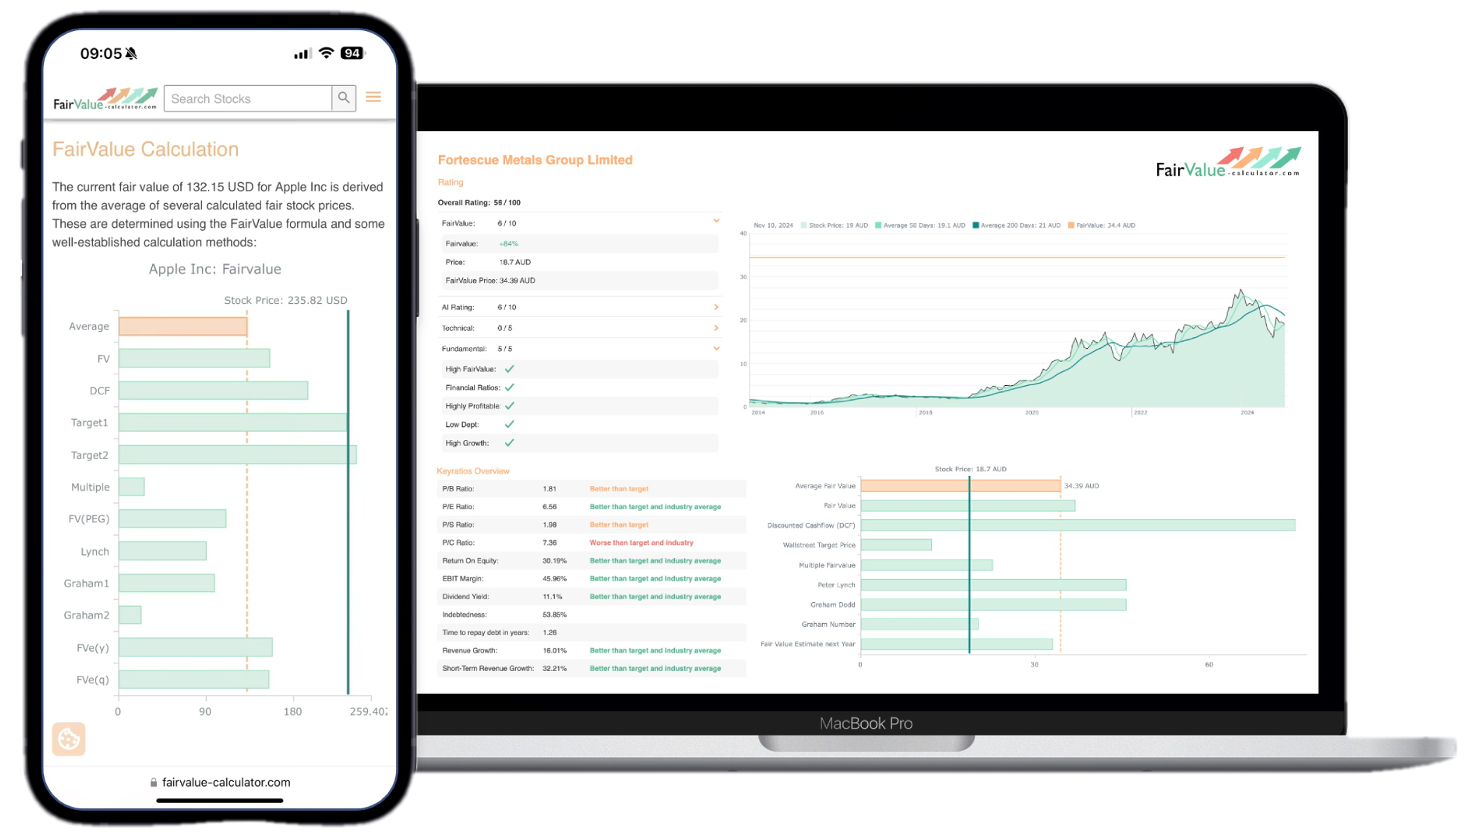
Stop guessing – start investing with confidence. Our Fair Value Stock Calculators help you uncover hidden value in stocks using time-tested methods like Discounted Cash Flow (DCF), Benjamin Graham’s valuation principles, Peter Lynch’s PEG ratio, and our own AI-powered Super Fair Value formula. Designed for clarity, speed, and precision, these tools turn complex valuation models into simple, actionable insights – even for beginners.
Learn More About the Tools →Basic DDM Formula in Excel:
=D2/(E2-F2)Where:

- D2 = Expected annual dividend per share
- E2 = Required rate of return
- F2 = Dividend growth rate
Gordon Growth Model (for constant growth):
=D2*(1+F2)/(E2-F2)Multi-stage DDM Formula: For companies with varying growth phases, implement a multi-stage model:
=SUMPRODUCT(G2:G6/(1+$E$2)^ROW(A2:A6))+H7/(E2-I2)/(1+E2)^5Where G2:G6 represents projected dividends for years 1-5, H7 is the terminal year dividend, and I2 is the terminal growth rate.
Discounted Cash Flow Model
The DCF model values stocks based on projected free cash flows, making it suitable for companies with irregular or no dividend payments.
Free Cash Flow Calculation:
=J2-K2-L2Where:
- J2 = Operating Cash Flow
- K2 = Capital Expenditures
- L2 = Change in Working Capital
Present Value of Cash Flows:
=M2/(1+$E$2)^ROW(A2)Terminal Value Calculation:
=M6*(1+$I$2)/($E$2-$I$2)/(1+$E$2)^5Enterprise Value Formula:
=SUM(N2:N6)+O6Equity Value per Share:
=(P2-Q2-R2)/S2Where:
- P2 = Enterprise Value
- Q2 = Total Debt
- R2 = Preferred Stock
- S2 = Shares Outstanding
Relative Valuation Methods
Relative valuation compares the target stock to similar companies or industry benchmarks using financial ratios.
P/E Ratio Fair Value:
=T2*U2Where:
- T2 = Projected Earnings per Share
- U2 = Industry Average P/E Ratio
P/B Ratio Fair Value:
=V2*W2Where:
- V2 = Book Value per Share
- W2 = Industry Average P/B Ratio
PEG Ratio Adjustment:
=T2*(U2*X2/100)Where X2 represents the expected earnings growth rate.
Advanced Valuation Techniques
Professional models often incorporate additional sophistication through Monte Carlo simulation, scenario analysis, and risk adjustments.
Risk-Adjusted Discount Rate (CAPM):
=Y2+Z2*(AA2-Y2)Where:
- Y2 = Risk-free rate
- Z2 = Beta coefficient
- AA2 = Market return
Weighted Average Cost of Capital (WACC):
=BB2*(1-CC2)*DD2/EE2+FF2*GG2/EE2Where:
- BB2 = Cost of debt
- CC2 = Tax rate
- DD2 = Market value of debt
- EE2 = Total firm value
- FF2 = Cost of equity
- GG2 = Market value of equity
Sensitivity Analysis Implementation
Sensitivity analysis examines how changes in key assumptions affect fair value estimates. Create data tables using Excel’s built-in functionality:
Two-Variable Data Table for DCF:
=DATA→What-If Analysis→Data TableRow Input Cell: Growth RateColumn Input Cell: Discount RateScenario Analysis Formula:
=CHOOSE(HH2,II2,JJ2,KK2)Where HH2 contains scenario selector (1, 2, or 3) and II2:KK2 contain fair values for pessimistic, base case, and optimistic scenarios.
Model Validation and Quality Checks
Implement validation checks to ensure model integrity:
Input Validation:
=IF(OR(E2<=0,E2>1),"Error: Invalid discount rate","OK")Circular Reference Check:
=IF(ISERROR(LL2),"Check for circular references","OK")Reasonableness Test:
=IF(ABS((MM2-NN2)/NN2)>0.5,"Review assumptions","Within range")Best Practices and Implementation Guidelines
When building Excel-based valuation models, maintain clear documentation of assumptions, data sources, and methodologies. Use consistent naming conventions for cells and ranges, implement error checking throughout the model, and regularly update market data and financial statements.
Create user-friendly interfaces with drop-down menus for key assumptions and clear output summaries. Consider implementing macro functionality for automated data updates, though this should be balanced against model transparency and accessibility.
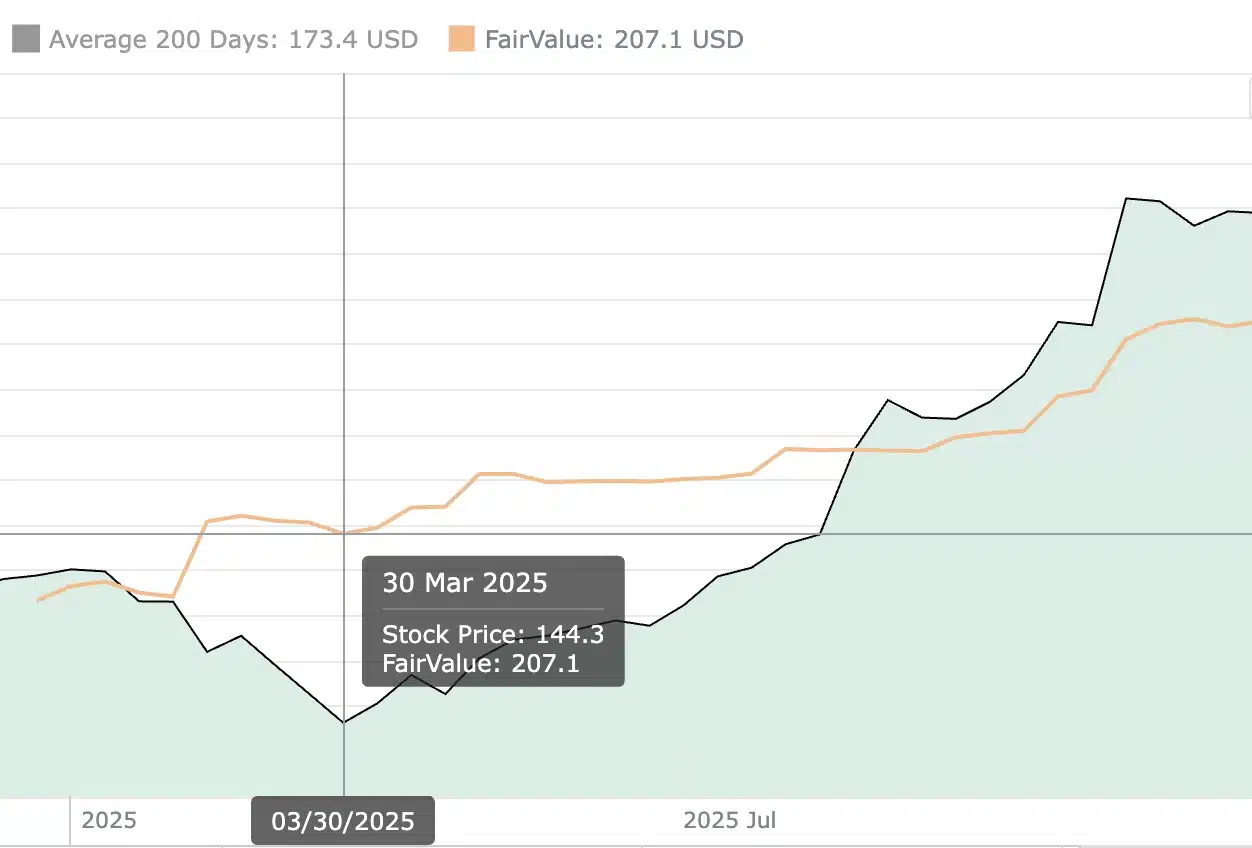
Regular back testing against historical performance helps validate model accuracy and identify areas for improvement. Compare fair value estimates to actual market prices over time to assess model effectiveness and calibrate assumptions accordingly.
Conclusion
Excel-based stock fair value calculators provide powerful, flexible tools for investment analysis when properly constructed. By incorporating multiple valuation methodologies, sensitivity analysis, and robust quality checks, these models can deliver professional-grade insights for investment decision-making.
The key to successful implementation lies in understanding the theoretical foundations of each valuation method, maintaining rigorous data quality standards, and continuously refining assumptions based on market feedback. While no valuation model can predict short-term price movements with certainty, well-designed fair value calculators provide essential frameworks for long-term investment analysis and portfolio management.
Success with Excel-based valuation models requires ongoing maintenance, regular updates to reflect changing market conditions, and careful consideration of model limitations. When used appropriately, these tools become invaluable components of comprehensive investment analysis processes, providing the quantitative foundation for informed investment decisions in dynamic market environments.
FAQs
How to Calculate Fair Value for a Stock?
Calculating fair value requires a systematic approach using multiple methodologies to arrive at a comprehensive estimate. The process involves five key steps:
Step 1: Financial Data Collection Gather the company’s financial statements, focusing on earnings, cash flows, dividends, and balance sheet items. Key metrics include earnings per share (EPS), free cash flow per share, book value per share, and dividend history.
Step 2: Growth Rate Analysis Analyze historical growth patterns and project future growth rates for earnings, dividends, and cash flows. Use the sustainable growth rate formula:
excel
=ROE*(1-Payout_Ratio)Where ROE = Return on Equity and Payout_Ratio = Dividends/Net Income.
Step 3: Discount Rate Determination Calculate the appropriate discount rate using CAPM or WACC, depending on the valuation method. The discount rate should reflect the investment’s risk profile relative to the market.
Step 4: Apply Multiple Valuation Models Use at least three different approaches: DCF analysis for cash flow-generating companies, DDM for dividend-paying stocks, and relative valuation using industry multiples.
Step 5: Triangulate Results Weight the results from different methods based on their reliability for the specific company and industry. A typical weighting might be 40% DCF, 30% DDM, and 30% relative valuation.
What is Peter Lynch’s Fair Value Formula?
Peter Lynch, the legendary Fidelity fund manager, developed a simplified approach to stock valuation that focuses on the relationship between growth and valuation multiples. His method emphasizes the PEG ratio (Price/Earnings-to-Growth ratio) as a key metric.
Lynch’s PEG Ratio Formula:
excel
=PE_Ratio/Growth_RateLynch’s rule suggests that a fairly valued stock should have a PEG ratio of approximately 1.0. Stocks with PEG ratios below 1.0 are potentially undervalued, while those above 1.0 may be overvalued.
Lynch’s Fair Value Calculation in Excel:
excel
=EPS_Next_Year*Growth_Rate/100Enhanced Lynch Model with Dividend Yield: Lynch also considered dividend yield in his analysis, particularly for slower-growing companies:
excel
=(Growth_Rate+Dividend_Yield)*EPS_CurrentLynch’s Sector-Specific Adjustments: Different industries warrant different PEG ratio expectations:
- High-growth technology: PEG of 1.5-2.0 may be acceptable
- Utilities and mature industries: PEG should be closer to 0.5-1.0
- Cyclical stocks: Use normalized earnings over a full cycle
Implementation in Excel:
excel
=IF(PEG_Ratio<0.5,"Significantly Undervalued", IF(PEG_Ratio<1.0,"Undervalued", IF(PEG_Ratio<1.5,"Fairly Valued","Overvalued")))How Does Warren Buffett Calculate Fair Value?
Warren Buffett’s approach to valuation centers on the concept of intrinsic value, which he defines as the present value of all future cash flows that can be taken out of a business during its remaining life. Buffett’s methodology emphasizes several key principles:
Buffett’s Owner Earnings Formula: Owner earnings represent the actual cash that owners can extract from the business:
excel
=Net_Income+Depreciation+Amortization-CapEx-Working_Capital_ChangeBuffett’s 10-Year Treasury Comparison: Buffett often compares a company’s earnings yield to the 10-year Treasury rate:
excel
=EPS/Stock_PriceIf the earnings yield significantly exceeds the Treasury rate, the stock may be undervalued.
Buffett’s Rule of 72 Growth Assessment: To evaluate growth sustainability, Buffett uses the Rule of 72:
excel
=72/Growth_RateThis shows how many years it takes for earnings to double at a given growth rate.
Buffett’s Intrinsic Value Calculation:
excel
=Owner_Earnings*15/Treasury_Rate_PercentThis formula assumes that a business should trade at 15 times earnings when the 10-year Treasury yields around 6-7%.
Buffett’s Margin of Safety: Buffett never pays full intrinsic value, instead requiring a significant margin of safety:
excel
=Intrinsic_Value*0.67This represents paying no more than 67% of calculated intrinsic value.
Book Value Growth Analysis: For financial companies and asset-heavy businesses, Buffett examines book value growth:
excel
=((Current_Book_Value/Historical_Book_Value)^(1/Years)-1)*100How to Calculate Intrinsic Value of a Stock in Excel?
Intrinsic value calculation in Excel requires building a comprehensive discounted cash flow model that projects future performance and discounts it to present value. Here’s a step-by-step Excel implementation:
Step 1: Free Cash Flow Projection Create a 10-year projection model:
excel
=FCF_Base*(1+Growth_Rate)^YearStep 2: Terminal Value Calculation Calculate the value beyond the projection period:
excel
=FCF_Year10*(1+Terminal_Growth)/(Discount_Rate-Terminal_Growth)Step 3: Present Value of Cash Flows Discount each year’s cash flow to present value:
excel
=FCF_Year/((1+Discount_Rate)^Year)Step 4: Sum All Present Values
excel
=SUM(PV_FCF_Years1to10)+Terminal_Value/(1+Discount_Rate)^10Step 5: Calculate Per-Share Intrinsic Value
excel
=(Enterprise_Value+Cash-Total_Debt)/Shares_OutstandingAdvanced Excel Model with Scenarios:
excel
=CHOOSE(Scenario, Pessimistic_Intrinsic_Value, Base_Case_Intrinsic_Value, Optimistic_Intrinsic_Value)Quality Metrics Integration: Incorporate Buffett-style quality metrics:
excel
=IF(AND(ROE>15,Debt_to_Equity<0.5,Current_Ratio>1.5), Intrinsic_Value, Intrinsic_Value*0.85)Dynamic Growth Rate Calculation: Use historical data to project realistic growth:
excel
=MAX(MIN((ROE*Retention_Ratio),Industry_Average_Growth),GDP_Growth)Risk Adjustment Factor: Adjust intrinsic value based on business quality and predictability:
excel
=Base_Intrinsic_Value*Risk_FactorWhere Risk_Factor ranges from 0.8 (high risk) to 1.2 (exceptional quality).
These methodologies can be combined within a comprehensive Excel model that allows users to input various assumptions and compare results across different valuation approaches, providing a robust framework for investment decision-making.