Unlocking the secrets of finance can often feel like an exclusive club with complex rules and cryptic language. But what if calculating a company’s fair value wasn’t just reserved for Wall Street analysts? Imagine having the confidence to evaluate investment opportunities with the same precision and clarity as a seasoned financial expert. This guide aims to transform that imagination into reality by providing you with a clear, step-by-step approach to understanding fair value calculation, using real-world financial data as your toolkit.
The ability to calculate the fair value of a company isn’t just a skill, it’s a strategic advantage. As market conditions shift unpredictably and valuation metrics become more sophisticated, knowing how to accurately assess a company’s worth is crucial for making informed investment decisions. In this blog post, we will unravel the complexities of finance, offering you not only the methodologies but also practical insights into how each step fits into the larger picture of financial analysis. Whether you’re a budding investor or a curious learner, prepare to demystify the numbers and unlock the true potential of financial evaluation.

Understanding Fair Value Calculation Fundamentals
Fair value calculation is the process of estimating what a company or its assets are truly worth today, based on objective financial metrics and reasonable assumptions. It contrasts with market price, which can be influenced by sentiment or short-term events. By focusing on intrinsic value, investors can determine if a stock is overvalued, undervalued, or fairly priced before making a buy or sell decision.
The core of fair value rests on a few fundamental pillars: reliable financial data, realistic cash flow projections, and an appropriate discount rate that reflects risk. When someone asks, “Can you show me step-by-step how to calculate fair value of a company with given financials?” the answer lies in mastering these pillars. First, you gather accurate historical figures. Next, you project future performance. Finally, you discount those projections back to present value. Each segment builds on the previous one, forming a cohesive methodology that balances quantitative rigor with practical insight.
Gathering Essential Financial Data
Accurate inputs are the foundation for any valuation. Before attempting to calculate fair value, you need up-to-date financial statements, namely, the balance sheet, income statement, and cash flow statement. These documents offer snapshots of a company’s assets, liabilities, revenues, expenses, and cash movements over time.
Key financial data points include revenue growth rates, operating margins, capital expenditures, working capital changes, and debt levels. By collecting at least three to five years of historical data, you can identify trends and smooth out anomalies. Remember, quality data reduces uncertainty, so verify your numbers against multiple sources such as audited reports, regulatory filings, and reputable financial databases.
Analyzing Historical Performance Metrics
Looking back at a company’s track record helps you understand its stability, profitability, and growth trajectory. Before projecting future cash flows, examine metrics like compound annual growth rate (CAGR), return on equity (ROE), and free cash flow (FCF) margin over the past several years.
This step isn’t just number crunching, it’s about context. Compare performance against industry peers and macroeconomic conditions to assess whether past trends are sustainable. Identifying one-off events, such as asset sales or extraordinary expenses, ensures your valuation model isn’t skewed by non-recurring items.
Explore our most popular stock fair value calculators to find opportunities where the market price is lower than the true value.
- Peter Lynch Fair Value – Combines growth with valuation using the PEG ratio. A favorite among growth investors.
- Buffett Intrinsic Value Calculator – Based on Warren Buffett’s long-term DCF approach to determine business value.
- Buffett Fair Value Model – Simplified version of his logic with margin of safety baked in.
- Graham & Dodd Fair Value – Uses conservative earnings-based valuation from classic value investing theory.
- Intrinsic vs. Extrinsic Value – Learn the core difference between what a company’s really worth and what others pay.
- Intrinsic Value Calculator – A general tool to estimate the true value of a stock, based on earnings potential.
- Fama-French Model – For advanced users: Quantifies expected return using size, value and market risk.
- Discount Rate Calculator – Helps estimate the proper rate to use in any DCF-based valuation model.
Forecasting Future Cash Flows
Future cash flows are the lifeblood of discounted cash flow (DCF) models. Estimating these involve projecting revenues, operating costs, taxes, capital expenditures, and changes in working capital for a finite forecast period, usually five to ten years.
Begin with a top-down or bottom-up revenue forecast. Apply historical growth rates adjusted for market saturation, competitive dynamics, and company guidance. Then, convert revenues to free cash flow by subtracting operating expenses, taxes, and reinvestment needs. Document your assumptions clearly to ensure transparency and repeatability.
Selecting the Appropriate Discount Rate
The discount rate converts future cash flows into present value, reflecting the time value of money and risk profile. For equity valuations, the weighted average cost of capital (WACC) is commonly used; for unlevered cash flows, use the company’s cost of capital before debt.
WACC incorporates the cost of equity, derived via the capital asset pricing model (CAPM), and the cost of debt, weighted by their respective proportions in the capital structure. Adjust for country risk premium, industry volatility, and company-specific factors. A higher discount rate means greater perceived risk, which reduces present value.
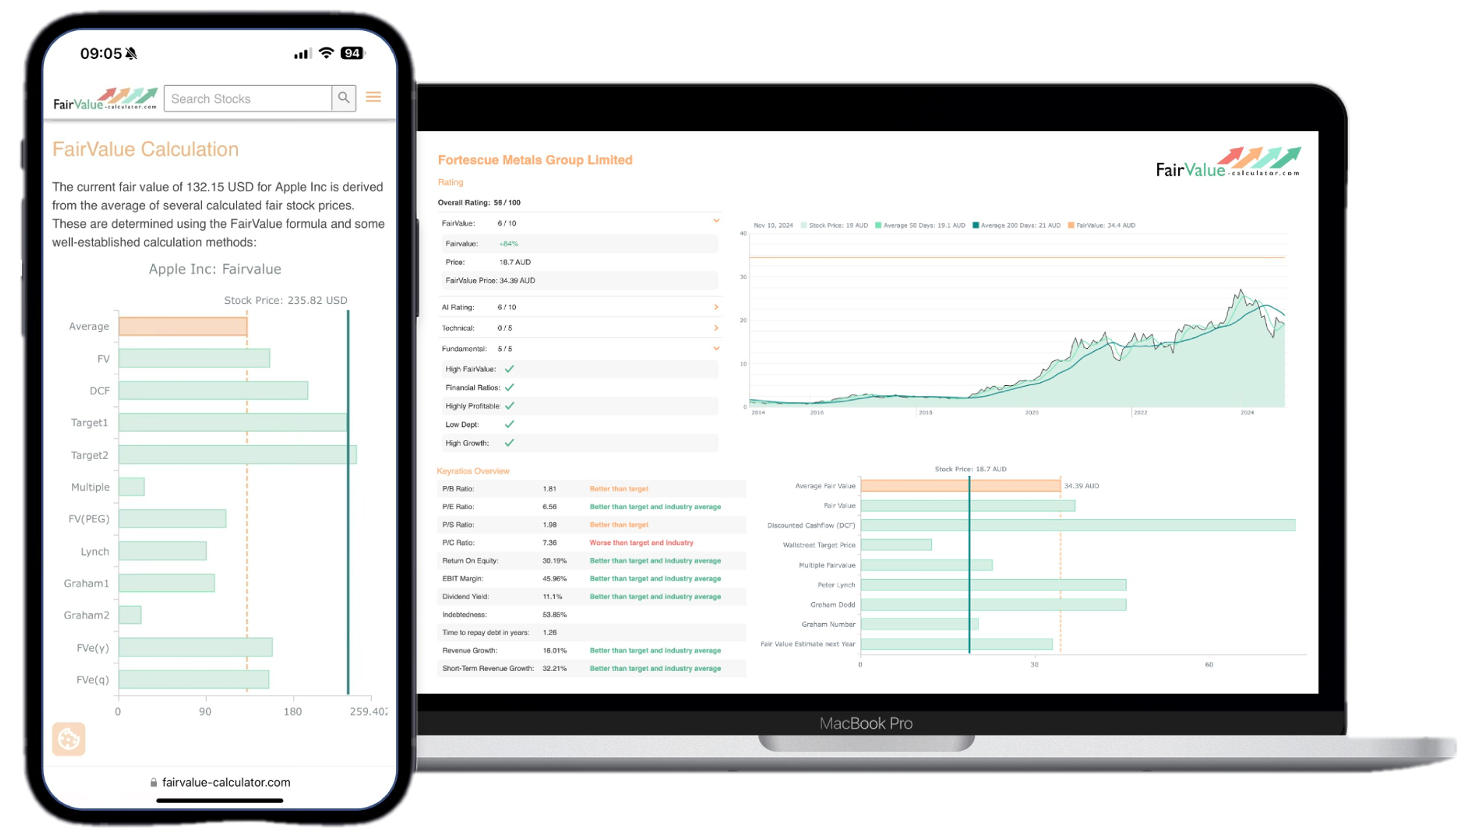
💡 Discover Powerful Investing Tools
Stop guessing – start investing with confidence. Our Fair Value Stock Calculators help you uncover hidden value in stocks using time-tested methods like Discounted Cash Flow (DCF), Benjamin Graham’s valuation principles, Peter Lynch’s PEG ratio, and our own AI-powered Super Fair Value formula. Designed for clarity, speed, and precision, these tools turn complex valuation models into simple, actionable insights – even for beginners.
Learn More About the Tools →Applying Valuation Models
With cash flow projections and a discount rate in hand, you can apply valuation models. The most widely used is the DCF model, which sums the present values of forecasted cash flows and a terminal value representing all cash flows beyond the forecast horizon.
Alternative approaches include the comparable company analysis (comps) and precedent transaction multiples. Comps use market multiples, such as EV/EBITDA or P/E ratios, of similar companies to estimate value. Precedent transactions look at acquisition prices paid for peer firms. Using multiple models provides cross-checks and reduces model risk.
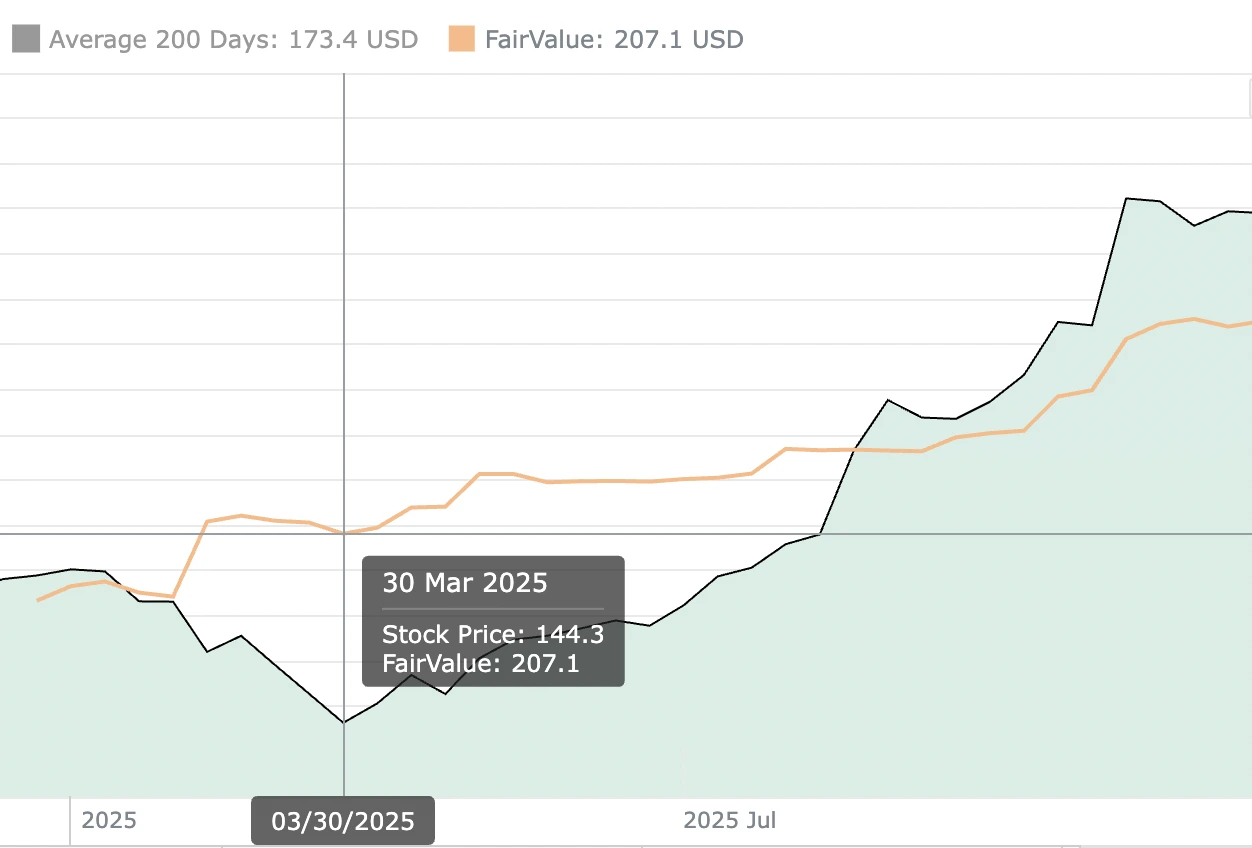
Interpreting Results and Making Comparisons
Once your models produce a fair value range, interpret the results in the context of the current market price. If the intrinsic value significantly exceeds market price, the stock may be undervalued; if it’s lower, the stock might be overpriced.
Compare your valuation to analyst estimates and consensus target prices to identify deviations. Large gaps warrant a review of assumptions, are your growth forecasts too optimistic, or is your discount rate too high? Iterative checks ensure a robust and defensible valuation thesis.

Incorporating Qualitative Factors
Numbers tell a big part of the story, but qualitative factors often influence a company’s trajectory. Consider management quality, competitive positioning, brand strength, and regulatory environment. These intangibles can justify premiums or discounts to your calculated fair value.
For example, a company with a visionary leadership team and strong patents may deserve a higher valuation multiple than peers. Conversely, looming regulatory changes or weak corporate governance might warrant caution and a more conservative estimate.
Fine-Tuning Your Fair Value Estimate
After building your base case, run sensitivity analyses. Adjust key inputs, growth rates, margins, discount rate, to see how they impact fair value. This process highlights which assumptions drive valuation risk and where to focus further research.
Scenario analysis, best case, base case, and worst case, provides a valuation range under different market conditions. This range equips you to make prudent investment decisions, balancing upside potential with downside protection.
Conclusion: Empowering Your Financial Evaluation Skills
By following these steps, gathering quality data, analyzing historical performance, forecasting cash flows, choosing the right discount rate, and applying valuation models, you now have a repeatable framework to calculate fair value. You’ve also learned to incorporate qualitative insights and fine-tune assumptions to reflect real-world complexities.
Mastering fair value calculation isn’t just about plugging numbers into a spreadsheet; it’s about developing a disciplined mindset for financial analysis. Armed with this guide, you can confidently ask yourself, “Can you show me step-by-step how to calculate fair value of a company with given financials?” and answer it with precision and clarity.